- Testing Basics
- Home
- /
- Learning Hub
- /
- What is Debugging
- -
- November 24 2023
What is Debugging: Strategies And Tools With Best Practices
Learn debugging strategies and tools to help developers rectify and fix bugs quickly and enhance software functionality.
OVERVIEW
Debugging is a critical process in software development. It involves identifying and resolving errors (bugs) that disrupt the regular operation of an application. The initial step in debugging is discovering a bug, which can be noticed by either the testing team or end-users when the application behaves unexpectedly. Once a bug is identified, fixing it and ensuring the software functions correctly again falls under the umbrella of debugging. In short, debugging is an essential and ongoing part of the Software Development Life Cycle (SDLC).
The challenge is identifying errors in a program and understanding their root causes. The team focuses on recognizing the cause of errors, which requires considerable effort, often involving collaboration among multiple groups. The difficulty increases with the application's size and the bugs' severity. Therefore, it is no surprise to see computer theorists putting their time into researching the methods and defining new vital strategies to shorten this process. The more random approach we follow, the more time it takes; hence, a tester and developer should always have this information handy. In a survey, research says developers spend 50% of their time debugging errors with random approaches.
Let us look into the history of debugging and its emergence in the following section.
A Brief History of Debugging
From the early 1900s till the 1940s, there was no such thing as a “bug” concerning computers. While the story of a “bug” stuck inside the machine is believed to be the first time this reference was used, in reality, it was already very popular in the late 1800s, dating back to the 1870s when Thomas Edison used it to define the glitches in his machine and how they were “bugging” him. The word “bug” started to pick up in mechanical fields quickly as it was often used as a synonym for a “glitch,” including in a car.
The outburst of the term “bug” was picked up in World War 2 when soldiers started using it to refer to the glitches in their war-related gears. During this time, computer scientist Grace Hopper, a Navy rear admiral in the United States, knew this term due to her defense background. When a computer operation failed due to an error while working, she documented this on the log as a “bug” and mentioned the current status as “they were debugging the issue.”
Due to its heavy usage in documents after that and its unique representation (referring to an insect and error), it has become a norm in computer science and even made its way to the Oxford Dictionary. The term debugging has been used since Hopper documented it, but its usage is primarily attributed to the popularity of “bug,” as they both are contradictions.
In this tutorial, we'll delve into what is debugging, exploring effective strategies and tools. By the end of this tutorial, you'll gain comprehensive insights into debugging and learn how to identify and address common errors that often surface during debugging. Let's get started.
What is Debugging?
Debugging involves finding and fixing errors or bugs in a software application. This process is crucial because if a bug is not identified and resolved, it can reach the end user and cause issues. The term "debugging" encompasses discovering and correcting these bugs. However, since one of the primary focus areas of a tester's job is to find bugs, developers sometimes do not include the process of “finding the bugs ” in debugging but keep it separate as part of the “testing ” process. Theoretically, it can be used in both ways.
Note : Uncover hidden bugs, understand their root cause, and enhance software reliability. Try LambdaTest Now!
Why do we Need Debugging?
The short answer to the importance of debugging is that developers are humans, and humans make mistakes. However, this is just one part of having bugs in the system.
Creating software involves logical thinking, unlike mechanical systems with clear test cases. Software scenarios are challenging to predict, and user behavior significantly impacts it. The second part of debugging involves addressing issues related to user interactions, emphasizing the importance of understanding and improving user behavior for effective software development.
When the team combines different software parts, it sometimes discovers that it needs fixing. That's why we have a dedicated testing team that comes up with various scenarios to catch issues. However, some bugs are so uncommon that only end-users can reveal them. That's when debugging becomes crucial. During debugging, the team tries to look for the root cause of the problem. Developers have often found that a seemingly small bug could escalate into something that might completely stop the application's processing.
It might seem like a quick solution if we skip debugging and only fix a specific bug when it becomes visible. However, this approach is like putting a band-aid on the issue. Soon, developers would find themselves repeatedly dealing with similar problems.
Debugging is like looking under the hood to understand "why" things are happening, not just "what" is happening. It may take a bit more time upfront, but it saves us from the headache of dealing with multiple similar bugs later on. In the long run, it's a more efficient and cost-effective strategy for the project.
Knowing what debugging is and why we need to debug the software development process, it is also essential to understand the different types, which we will discover in the next section.
Types of Debugging
A developer's debugging journey can be segregated into two types:
- Reactive Debugging.
- Preemptive Debugging.
Both approaches define a clear and separate timeline followed to rectify the bugs.
Reactive Debugging
If the developer uses a method to debug after the bug has been found (reacting towards it), it is termed reactive debugging. One typical example of this is applying print statements over the code to know the values of variables.
Preemptive Debugging
This method follows a preventive measure before a bug is found to either find it sooner (if it exists) or rectify it as quickly as possible. It will involve some extra code, but the code does not (and should not) impact any functionality of the application. One typical example of preemptive debugging is the logging feature that logs various actions and states of an application in execution.
Preemptive debugging should always be in place for the most optimal results in the code base. It cuts down time, and developers may not even be required to reproduce the bug on their machine. The more precautions developers take, the easier it becomes to rectify a bug.
This section has given you a good idea about the two available debugging methods. Let us discover the different types of errors that a developer or tester may encounter in the below section.
Types of Errors Developer Encounters
To start the debugging process, developers should know the bugs they might encounter. Below are some errors that will narrow down software professionals' thought processes and help them rectify them quickly.
Build Errors
Build errors are those errors that appear while building up the code. They are generally of two types:
- Syntax errors
- Linker Errors
Let us look into each error in detail.
Syntax Errors
Syntax errors are associated with deploying the wrong syntax in the program corresponding to the language. A programming language has its own set of rules, standards, and grammar. A developer must adhere to those rules to convert the code into valuable actions. A simple mistake in these rules can generate errors called syntax errors.
For instance, missing a closed quotation mark in Python's print function can raise the syntax error as follows:
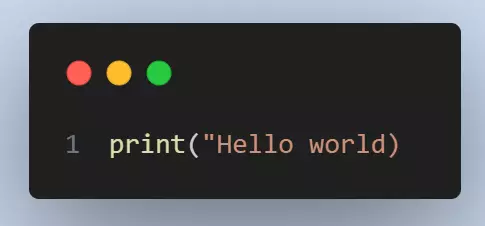
Result

The syntax error also states the reason, in this case, is that the developer has not defined the end of the string that needs to be printed. This Python rule requires developers to enclose the printing string for it to understand. Let us know this syntax error with another example: a grammar error, such as not providing the correct brackets.
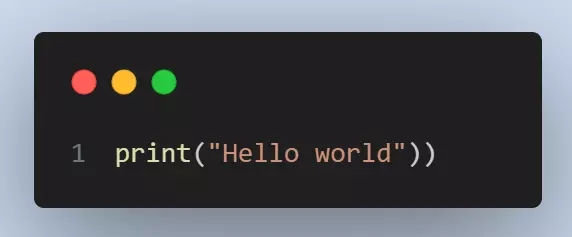
Result

Here, the error appears due to an additional closing bracket that does not have a matching opening bracket. Syntax errors are quick to debug as interpreters and compilers can understand them and point out the exact lines, as shown in the above examples. They are often the most common errors on a piece of code but also most easily resolved.
Note : Choose any language and testing framework from various options and run parallel tests across multiple browsers and OS combinations. Try LambdaTest Now!
Linker Errors
Another standard build error is the linker error. A linker must link all the necessary parts of the code to the current program to build it and execute it later. Developers use code that requires connecting to avoid repetitiveness and increase the programmer's convenience.
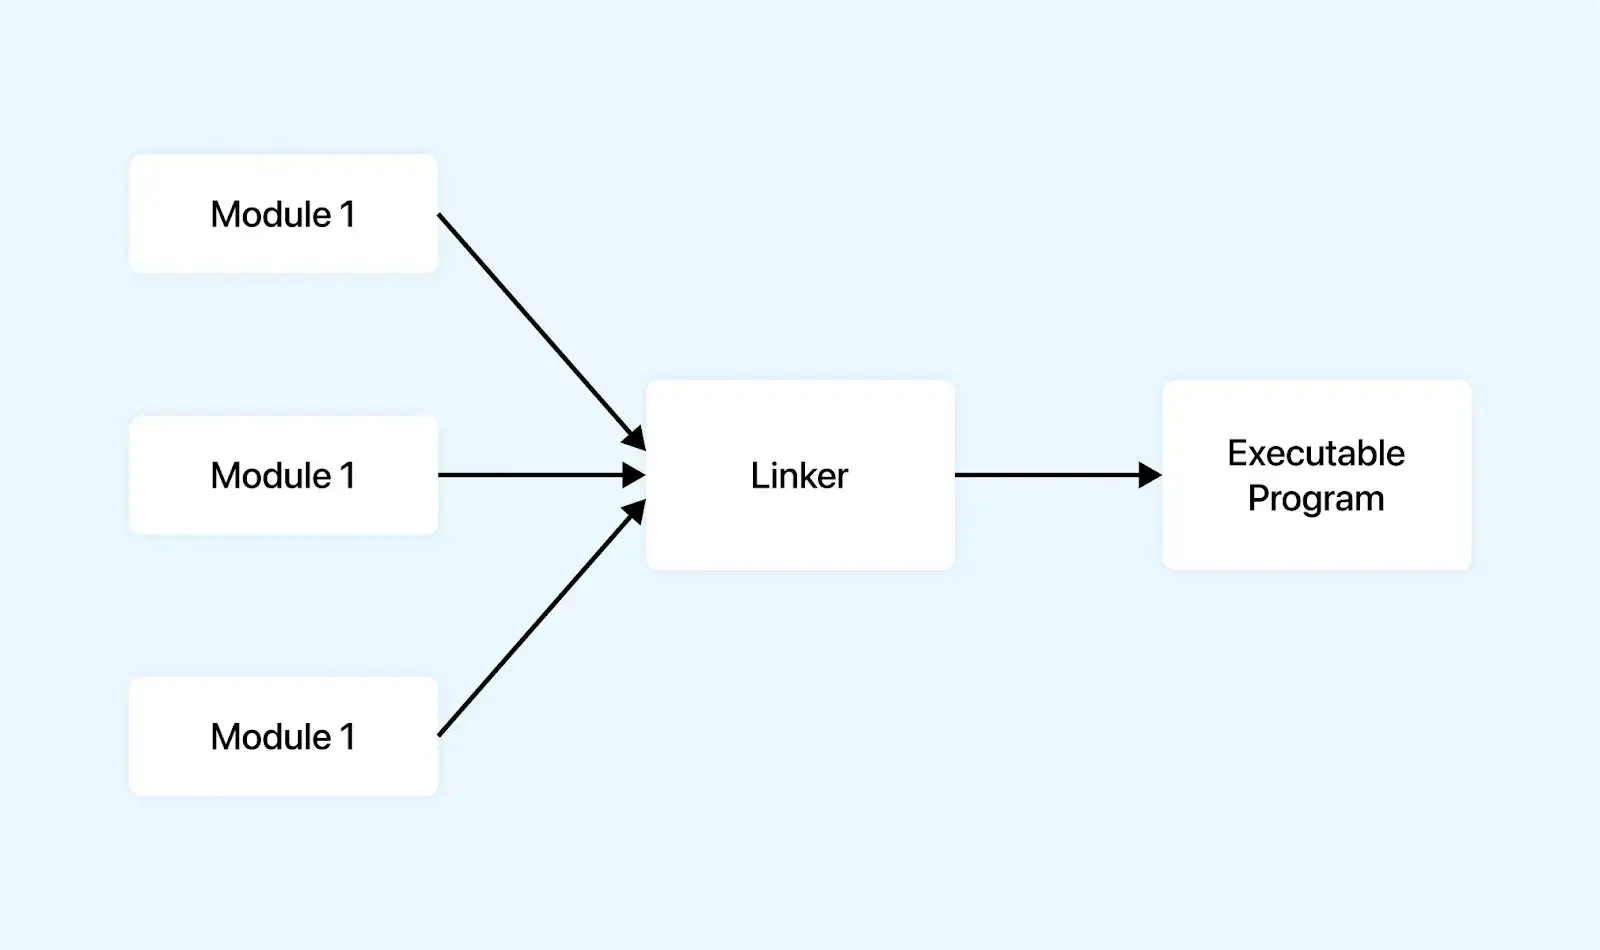
For instance, library names are attached to the program, which is then linked later by the linker before we run the program to check the validity of functions and other associated methods. In machine language, too, we use relative memory addressing to avoid memorizing all the memory addresses, especially when data structures such as arrays are used.
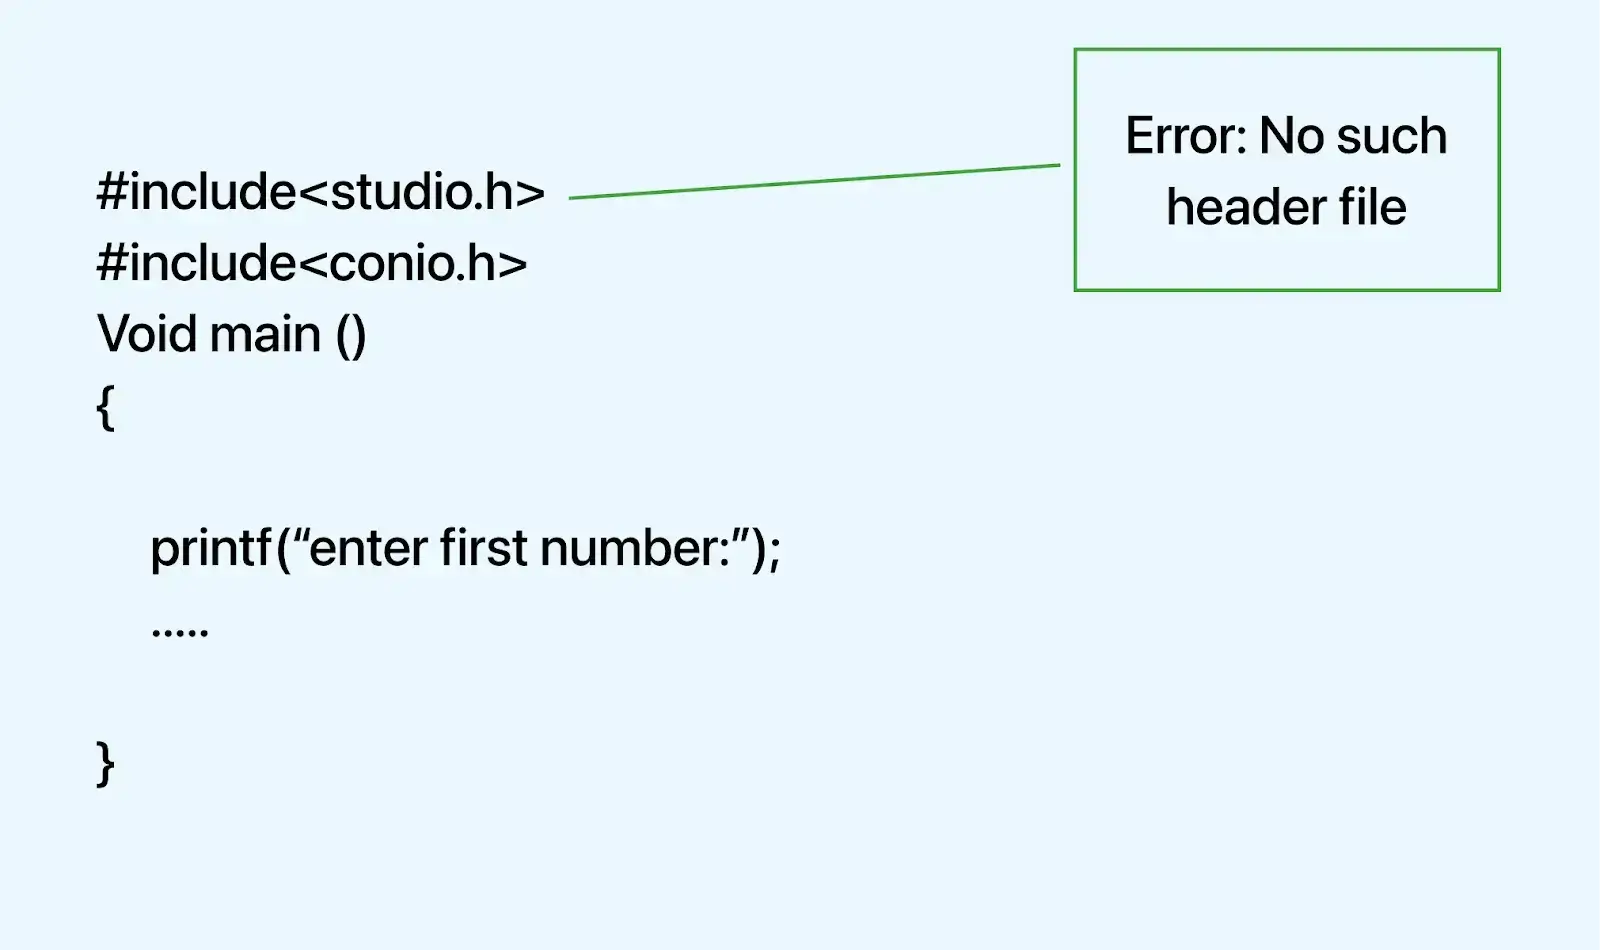
When a linker cannot find anything required in the program, it raises a “linker error.” For instance, this linker error was introduced due to a missing library:
Semantic Errors
In programming languages, a semantic error means the purpose of the code a developer wishes to write is wrong. However, the syntax is correct; therefore, the program will compile, build, and run successfully but will not produce accurate results. This is similar to writing “My name is 123,” which is grammatically correct but meaningfully wrong.
Let's consider an example where the developer needs to print out the current year when they have a user's age and birth year.
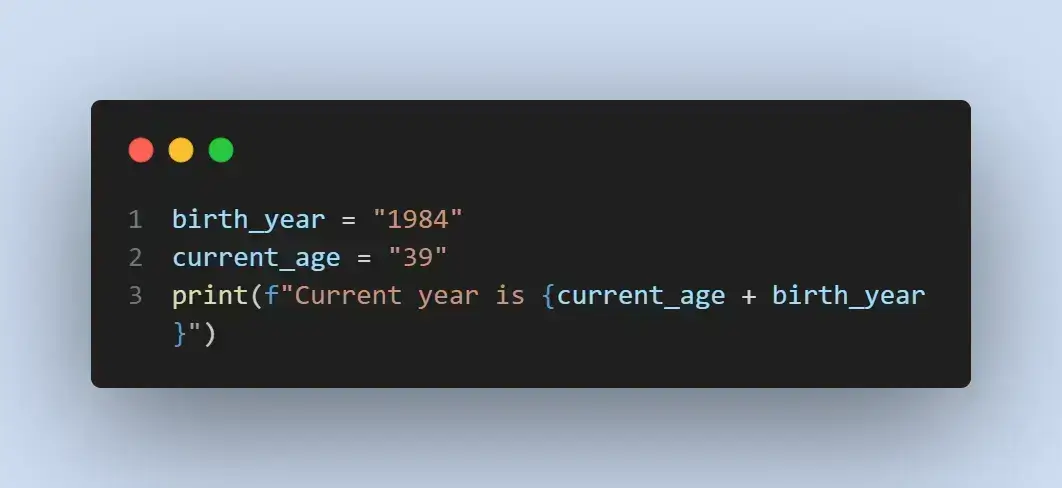
The current year should be the age added to the birth year, which the developer wrote in the print statement. However, the program's output is as follows.
Result

The output is incorrect, but the program has been executed successfully without raising any errors. It means the meaning of the program, i.e., its semantics, is wrong. If we notice carefully, the current year is the concatenation, not the addition of the birth year and the user's age. Digging deeper, it may be visible to the developers that the values used to represent the birth year and age are not integers but string values.
This is a simple example; therefore, the debugging part was straightforward. However, this may not be the case practically. Consider this value not to be printed but carried over to other functions that perform tasks such as putting down the entry into the database (which we do not see explicitly).
The developers and testers may be able to recover such a bug only through multiple layers of functions, and the debugging will require them to reverse their strategies and backtrack the flow. Semantic errors are hard to debug and are one of the program's most notorious bugs.
While semantic bugs can be initiated through multiple scenarios, a few common scenarios are as follows.
- Type mismatch - Whenever a developer mixes the type of variable (or other statements), a type mismatch occurs. For instance, passing string values to a function as arguments when integer values were required.
- Argument mismatch - An argument mismatch occurs whenever a developer passes the wrong number of arguments. For instance, the function definition may have three arguments, but the developer calls that function only by passing 2 in the calling function.
- Undefined variables - Whenever a developer uses a variable, function, method, etc., that has not yet been defined in the program, an undefined variable error occurs. In a few programming languages, this will raise the error and provide suggestions.
 However, many programming languages may also pick up garbage values and execute the program successfully. Developers must be extra cautious while using a name and use IDEs that automatically suggest declared names, such as IntelliJ.
 - Collisions - A naming collision occurs whenever a developer uses the same names for two things. For instance, they are defining two values with the same variable name.
Along with this, a developer may find other types of semantic bugs that change the meaning of the logic they apply. All of them are difficult to document.
Logical Errors
A logical error occurs when the logic applied through code by the developer differs from the actual actions required from that code. It is one of the most challenging debugging errors because the error is not in the syntax or semantics but in the logic itself. This means it could remain hidden for a long time and sometimes be only valid for specific scenarios. There are no fixed standards or rules to point out logical errors or how to debug them, which makes them a time-consuming task for a developer.
For a simple demonstration of a logical error, consider the example of finding an average of two numbers, which in mathematical terms is as follows:
- Add two numbers.
- Divide the sum by 2.
Consider the following Python code according to the above instruction set.
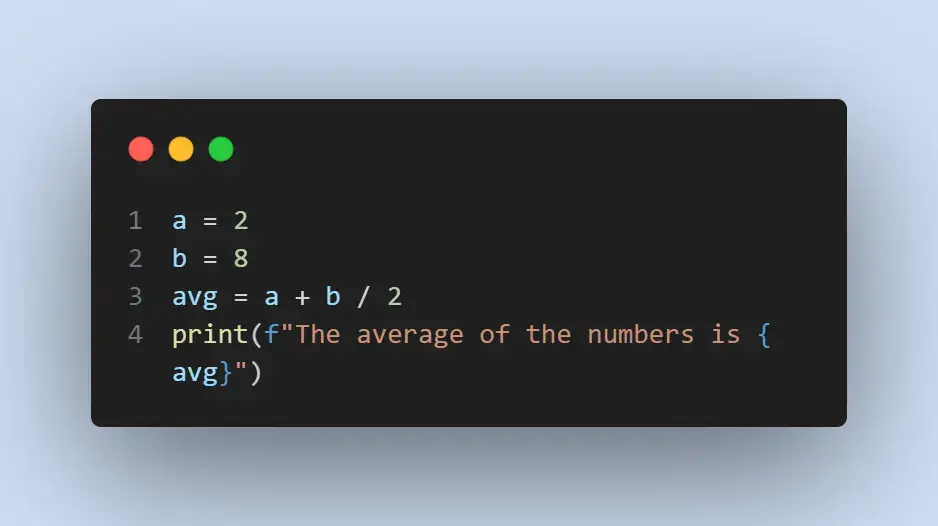
Result

Notice the error in the output that shows the average as 6.0, whereas the actual average of 2 and 8 should be 5.0. It is a logical error. The error lies in the BODMAS representation of the logic as division operation takes precedence over addition. On the contrary, we wanted addition to occur first in this case. This can quickly be resolved using brackets as follows.
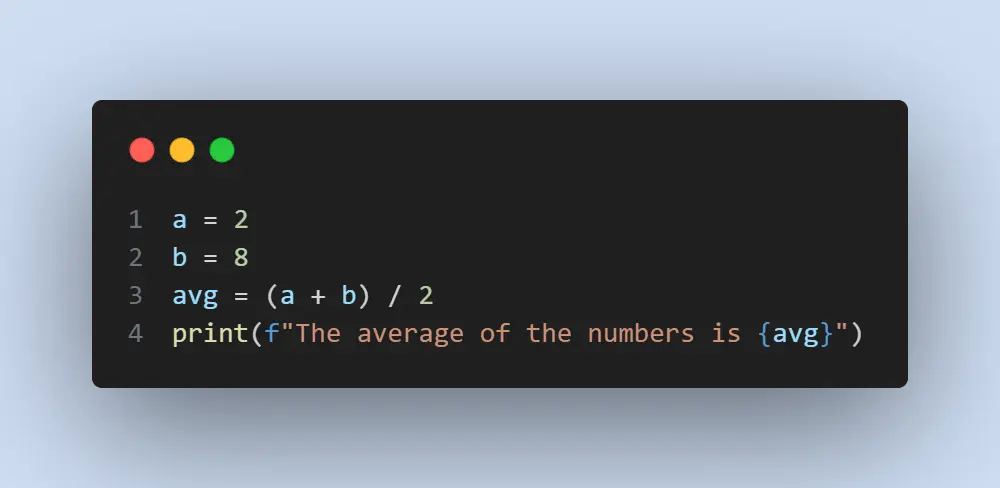
Result

As the readers can guess from this small demonstration, logical errors are tricky to debug. Here, the code is more straightforward than what we would do in real applications, including operating system function calls. When such codes execute successfully, debugging may require exploring all the intermediate values, which takes a lot of time! It is always recommended to write operational codes only after reading the operation documentation correctly.
Runtime Errors
Once the build is completed, the program's execution starts. The errors that appear during the build process are called build errors, and similarly, the errors that occur during the program's execution (during its run) are called runtime errors. These errors can appear for any reason, from logic-based defects (such as dividing by 0) to operating system-based errors (such as memory leaks).
For instance, consider this Python code trying to retrieve the fifth element from a list that contains only four elements.
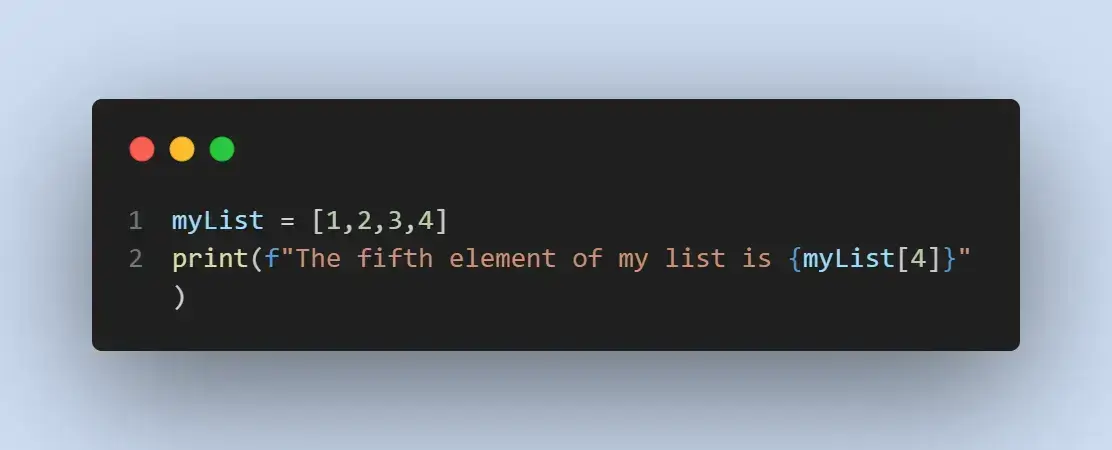
Result

The problem with runtime errors is that they depend only on specific scenarios, and most of the time, they may rely on particular systems only. For instance, if a user operating the application on a Windows operating system does not have a DLL file, the linking may prohibit him from accessing certain features. It could happen after the installation, during the application's startup, or when that particular file is required, which may crash the application. Due to the nature of runtime errors, it is tough to predict them by developers or the tester's team, and therefore, we may find most of our problems associated with runtime errors post-release.
Still, the testing team can watch out by mocking specific scenarios that are the culprit most of the time:
- Logic error: A simple error in the logic, such as retrieving an index that does not exist, or a mathematical error, such as dividing by 0, can raise runtime errors.
- Intentional: Users intentionally raise Runtime errors, such as pressing ctrl + c to terminate the current execution. Developers should be able to handle such terminations carefully.
- Memory-based: Accessing a memory block that does not exist or leaking memory registers can cause the program to crash instantly during runtime.
- Undefined errors: Accessing or retrieving functions and methods that are not yet defined can cause undefined errors and terminate the program.
- Device-related errors: Many things can go wrong when the operation targets an I/O device. It includes reading an unavailable file, malfunction of the I/O device, malfunction of the port, I/O compatibility issues, etc.
- Encoding issues: Operations involving encoding of files from one format to another require heavy memory usage and are vulnerable to runtime errors. Validations and exceptions should be kept in place for such scenarios.
It is tough to predict or mock the runtime errors in practical applications. They can happen for a lot of reasons that nobody can guess. It becomes difficult for developers to debug this scenario because they might need help reproducing it on their systems.
Studying the logs is one method, but it may not be as helpful as identifying the issue altogether. The developer can only ensure that validations and checks are appropriate and that any such case is caught and reported in logs for investigation.
Let us explore some of the strategies developers can apply to rectify the error after the developers have encountered the errors in the application.
Strategies for Debugging
Debugging strategies allow us to select a route by which we can see the root cause of the error. These strategies are designed to conclude faster to make our code base stable as early as possible. Some of the strategies are mentioned below.
Brute Force Method
When we most need to find something, we try first to follow a random approach. This approach lacks critical thinking; the developer just sees the error and the related code and tries to make fixes as what he may guess to be the issue. Sometimes, it may help, and the developer's experience also comes into play. If the developer has tackled the bug earlier, this approach is probably the best. Adopting this approach as the first option is recommended, but giving little time to hit-and-try methods.
Clustering Bugs
Another popular developer strategy is creating a cluster of related bugs for two reasons:
- Verify if the root cause is the same.
- Extract relevant information from each of them.
This method works because 80% of the bugs lie in 20% of the region of the overall code base. The first reason is rational and practically accurate most of the time. If two bugs are similar, they might be caused by the same defect, or if not, the two defects may have something in common.
The second reason focuses directly on the debugging process. Multiple bugs are produced through different actions. Therefore, these bugs will have additional documentation which may point to the exact root cause. Hence, the developer can extract further information from all of them and may even conclude things much faster.
Backtracking
The backtracking method, as its name suggests, tracks the flow of the program in the reverse order. The developer discovers the point in the program where the flow starts to provide unexpected results. It can be done through any methods discussed later in this tutorial. For instance, applying print statements at various points is one such method. When the developer reruns the program, the print statement can provide variable values exposing the end from where the error occurred.
As one can conclude from this example, backtracking can only be done on a small code base. If the code base is large, backtracking will consume much time just putting out print statements (for example) and may provide incorrect results.
Rubber Duck Method
It is a well-established phenomenon that when a person is stuck in a problem in any field, they are more likely to get an answer while explaining the situation to another person, preferably someone who doesn't have any relation with the area in which the problem exists. Programmers may approach a bug similarly when stuck and cannot think of any way to debug it. However, the only issue is that most people around a programmer are technical, and even if they are not, everybody is a bit busy with their work.
To find a non-technical companion who is always free to listen to our difficulties, programmers use a rubber duck instead. They speak out the problem to the duck, their understanding of it, and the approach they are considering. During this process, programmers realize what they were doing wrong or from where this bug can be resolved. Even if it doesn't get resolved entirely, this method has proved to be successful in making good progress toward resolution.
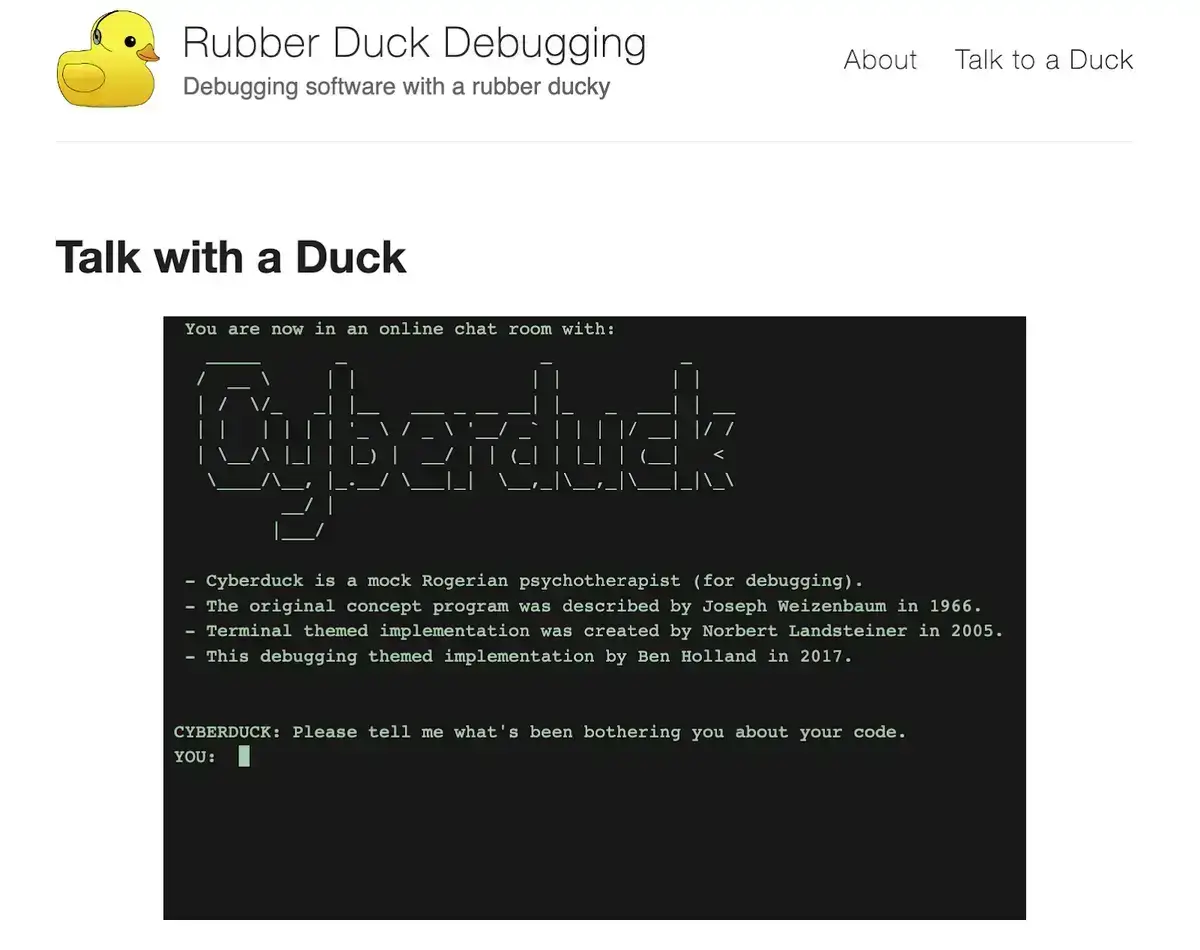
Why a duck? Well, the bird has no relevance here except that it was used in the story told in a popular book, The Pragmatic Programmer . Programmers have been seen using other rubber animals, such as teddy bears. Also, the book was released in 1999 when technology was less advanced. Today, programmers use the physical duck less than they would have done in those times. Instead, they can use natural language processing to talk to the machine, communicate over bots, or use the website Cyberduck developed specially for this purpose.
Binary Search Approach
A popular search approach used in computer science is binary search. To understand this, consider the book Yellow Pages, which contains the contact numbers of various people arranged alphabetically. Imagine you are looking for a name that starts with the letter 'C.' Instead of going through every page one by one, you decide to be smart about it.
You open the book in the middle and see two sections: one from A to M and the other from N to Z. Now, you know 'C' comes before 'M,' so you focus on the first half (A-M). You repeat the process: open that section in the middle and narrow it further.
By doing this, you quickly eliminate large chunks of the book until you find the page where names starting with 'C' are located. It's like playing a guessing game and narrowing down your options with each try. This method is much faster than starting from the beginning and checking every page, especially if the book is big. That's the idea behind dividing and conquering to find what you're looking for more efficiently.
Using this approach, a developer can debug the error by dividing the code base into halves until he has that part where the fault lies. So, a developer starts by dividing the entire codebase into half and checks which half could have the error. Then, again, divide it in half until a few lines remain, which can be debugged using brute force or backtracking.
Program Slicing
Computer scientist Mark Weiser introduced Program Slicing, A similar but more complex approach to binary search. In this approach, the developer divides the program into slices and keeps eliminating the code that does not play any role in the bug.
A slice depends on variable (v) and statement (x) and so can be described as
S = (v,x)
Regarding the above relation, a slice S is the set of lines from the program P that affects the variable v's value in the statement x.
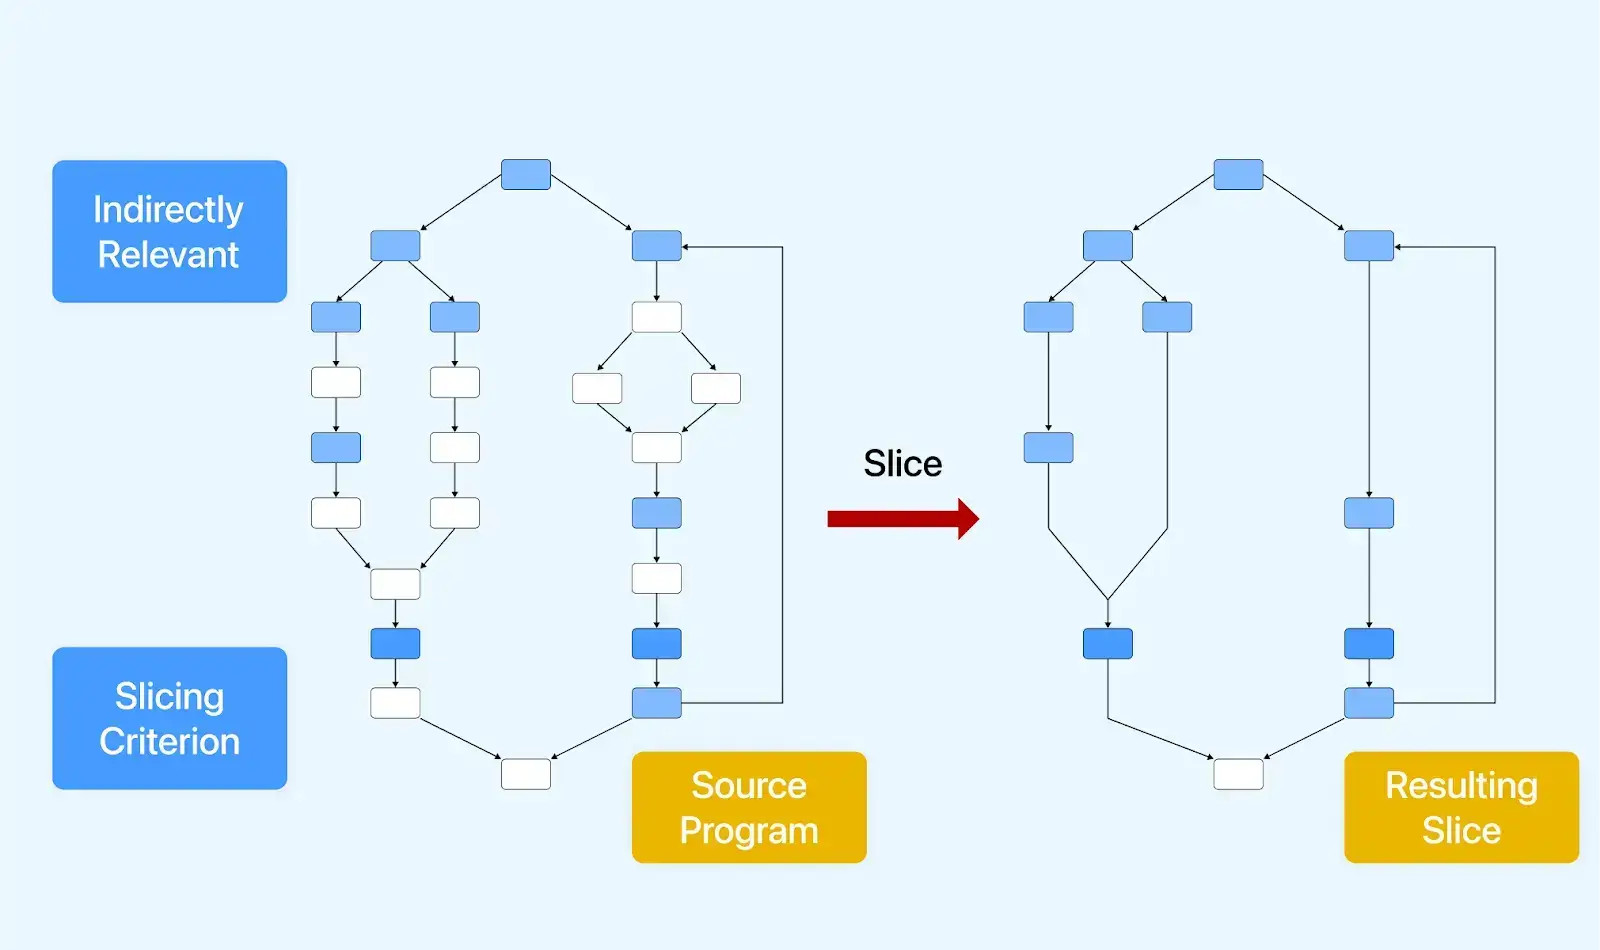
The focus is on variable changes, and by keeping only those lines that affect the variable values, we can narrow down the stress and analyze the statements, thereby facilitating the debugging process.
Cause Elimination Method
One of the most successful debugging methods with the highest hit rate is the cause elimination method. The developer performs various hypotheses related to the scenarios that could have caused the bug. It includes using multiple types of data. Then, the developer tries all of these scenarios and verifies if he can find something relevant. If not, more scenarios are hypothesized until some concrete relation to the bug that can lead to its rectification is explored.
The only problem with the cause elimination method is that the developer's experience is accountable for the quantity and quality of the scenarios. If the developer does not understand the software and code base well, this method will not provide the expected results.
With any one or a mix of these techniques, the developer can reduce the time and costs associated with debugging.
Now that we have seen different strategies let us explore the different approaches that can be helpful for developers to debug the code.
Different Approaches to Debug Code
The types of debugging discussed in the previous section serve as a larger area under which various practical methods are accommodated. These methods comprise the actions taken by the developers for the debugging process. Let's see each approach in detail that can help developers debug the code.
Print Statements
The print statements are an old and effective method to fetch the intermediate variable values, data types, and anything a developer would want to check. In this approach, we simply execute the print function, inside which we can print whatever we want.
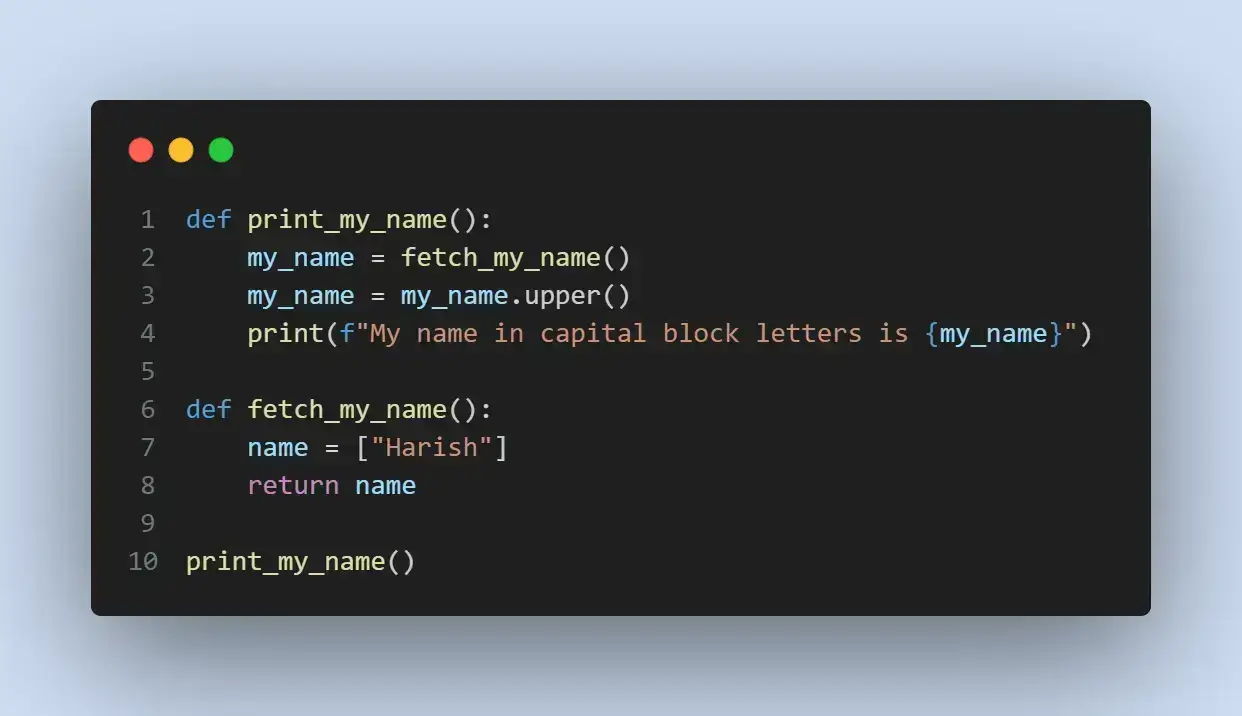
For instance, consider this Python program.
Result

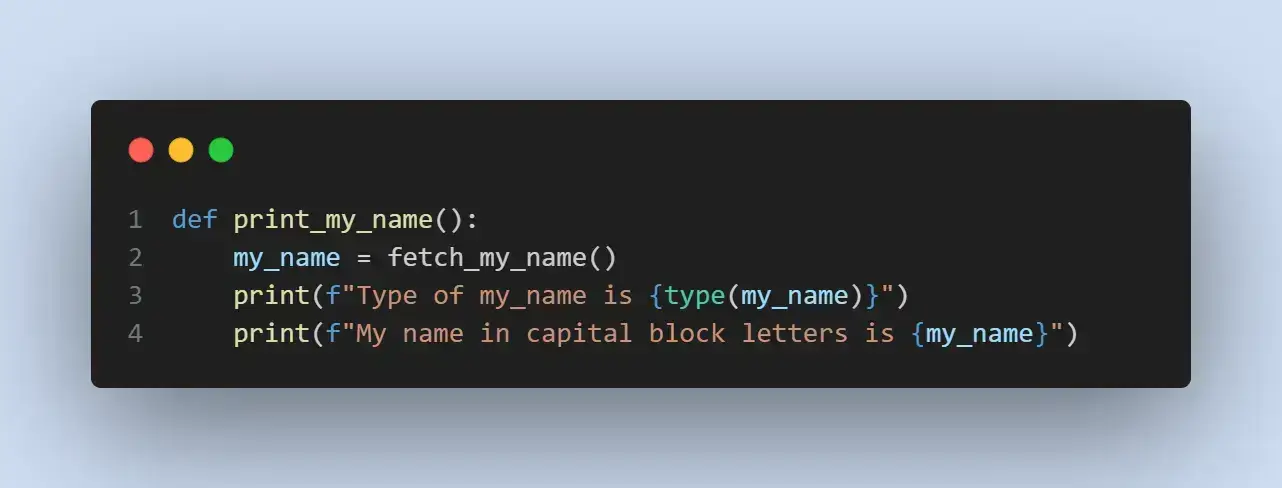
The result shows the name in brackets, which is different from what was intended. It raises suspicion over the changes in any of the functions. In this case, a developer can try out whether the name returned was a list or, if not, whether it got changed in between by adding a print statement.
Result

The print statement shows the type of variable in a list. This means this function is all right, but the fetch_my_name() function returns the wrong values. Analyzing the fetch_my_name() function shows that the initialization of the variable name was a list.
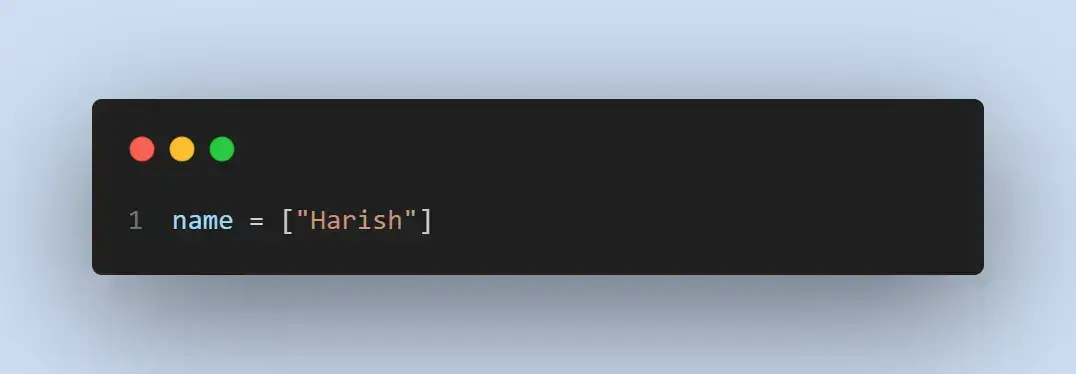
Instead of a string.
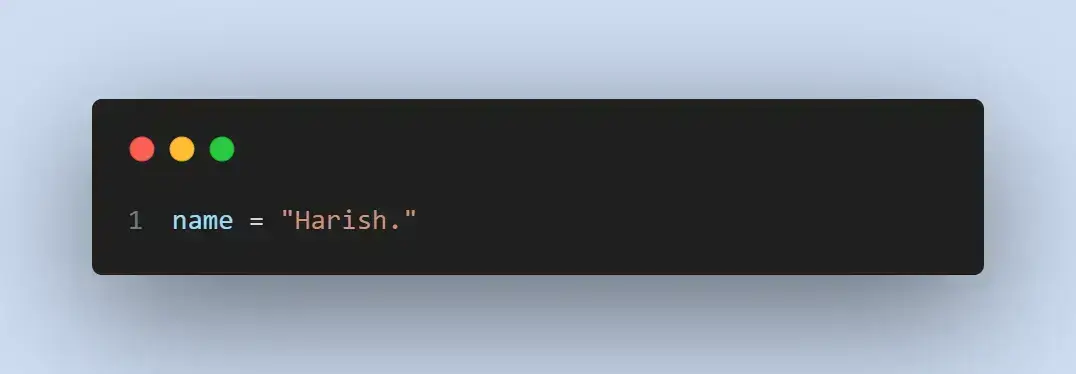
Following this process, a developer can reach the root cause and analyze where the error occurred by writing a few print statements.
Using a Debugger
Debuggers are programs explicitly designed to debug the execution of software. They are highly effective in reducing the debugging time, even in significant software.
Since debuggers are so powerful and famous, many companies have started developing their own, including those that develop IDEs as an additional plugin. However, All (or most) exhibit similar properties as mentioned below.
- Tracing the Program Flow: A debugger can trace the program flow, stopping at each line to let the developer know which lines got executed. This feature is also known as step into.
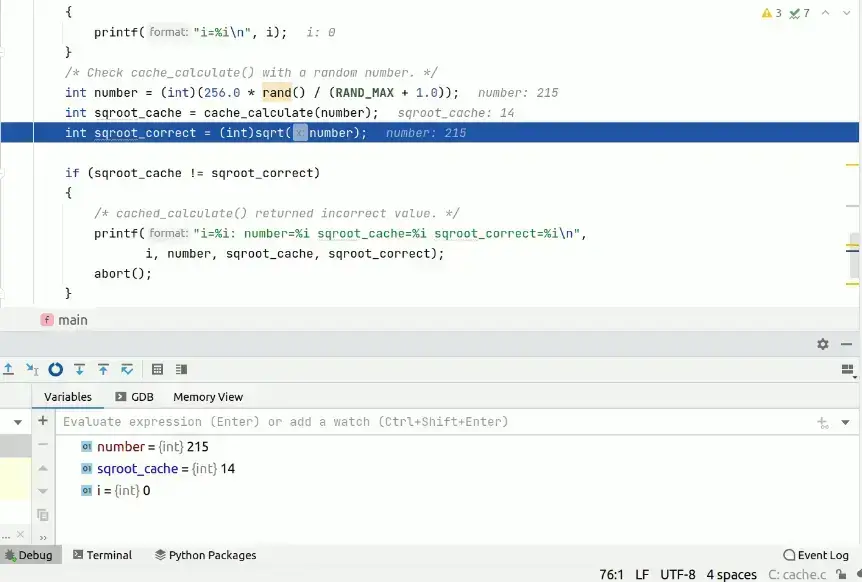
- Saving Intermediate Values: The debugger shows each intermediate value at any stage to the developer on the same screen for a better analysis. It helps observe data types, values, and function calls.
- Breakpoints: A debugger allows the programmer to place breakpoints at various places. At this point, the program execution should pause, and all the intermediate values should be shown.
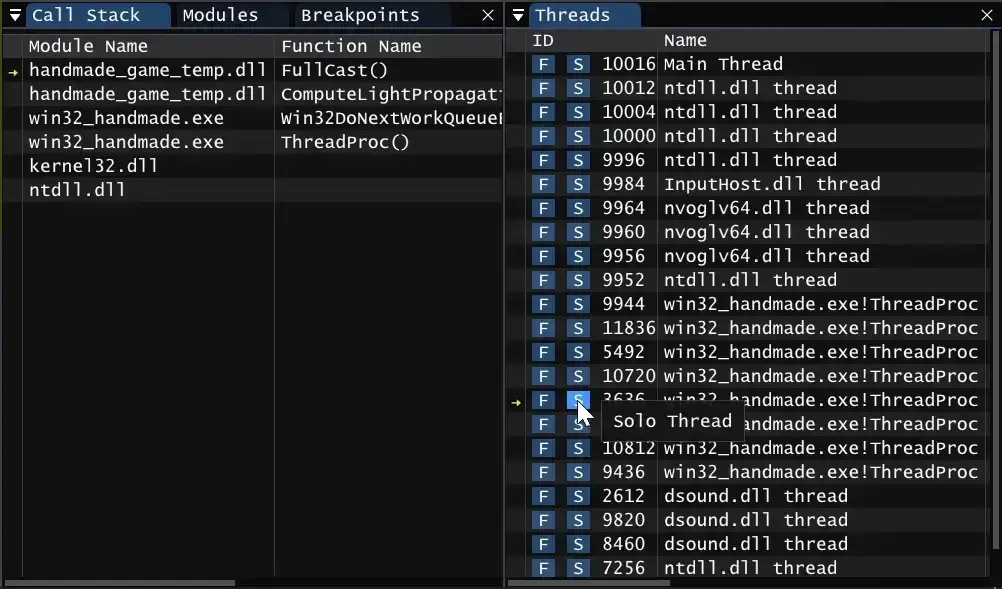
- Threads and Concurrent Calls: A good debugger efficiently exposes all the thread and concurrent function calls to the developer at any state (particularly breakpoints). This helps to know the cause of breakpoints or if the program is heading towards a deadlock.
- Hot Reload: Debugging requires a lot of iterations to verify each hypothesis, which may even take days. In such a scenario, no developer would only want to work on a program that takes a long time to compile when all he needed to see was a print statement. Hot reloading is a popular debugger feature that shows the output from the changed codebase live on the screen (connected screens, emulators, browsers, simulators, and real devices).
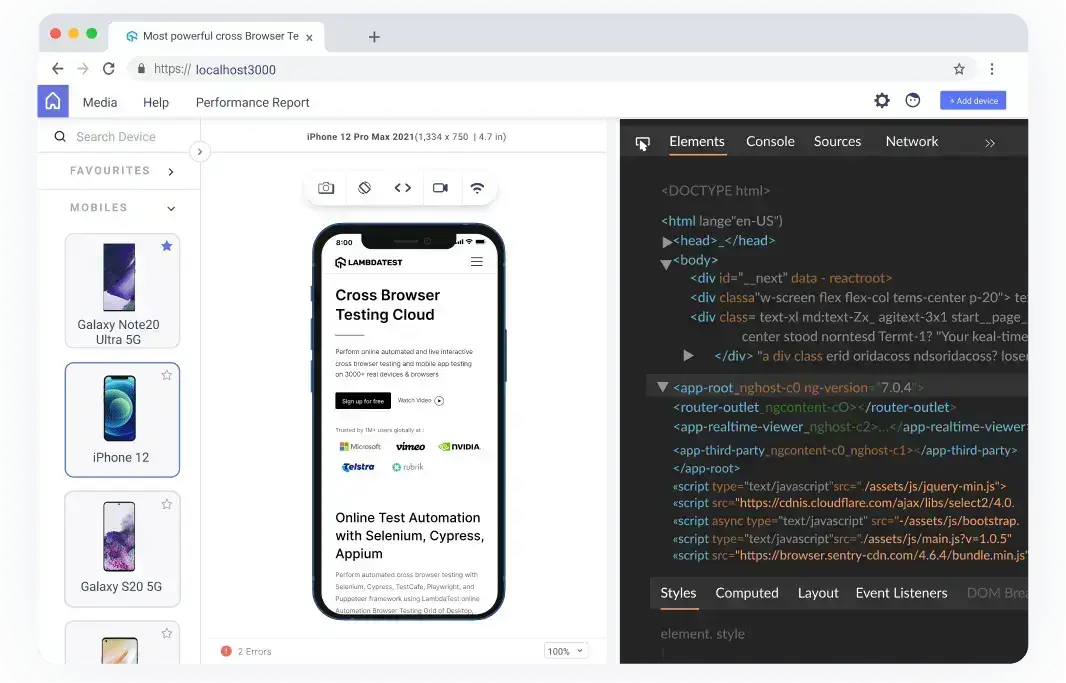
Use the popular debugger feature Hot reload with LT Browser to simplify the process. If you wish to try LT Browser, click on the button below. It will download a .exe file, and once installed, you can run the .exe file and make the most out of it.
Watch this video tutorial to get started with LT Browser, which will help you understand its functionalities and help make the debugging process easy.
Subscribe to the LambdaTest YouTube channel for more videos on Real device testing and Playwright testing and to elevate your testing game!
- Flow control: Debuggers should also possess a flow control mechanism where the developer can move one iteration ahead, backward, or simultaneously out of a complete loop (or function call).
These are a few necessary features a debugger should always possess. Apart from these, different debuggers try to bring other new things to the testers and developers, a choice they make solely based on project requirements or experience.
Using Breakpoints
For developers working on a web application, breakpoints are a standard functionality used in that domain. While for non-web applications, one may need a plugin or complete debugging software, for web apps, browsers provide this functionality as a part of developer tools.
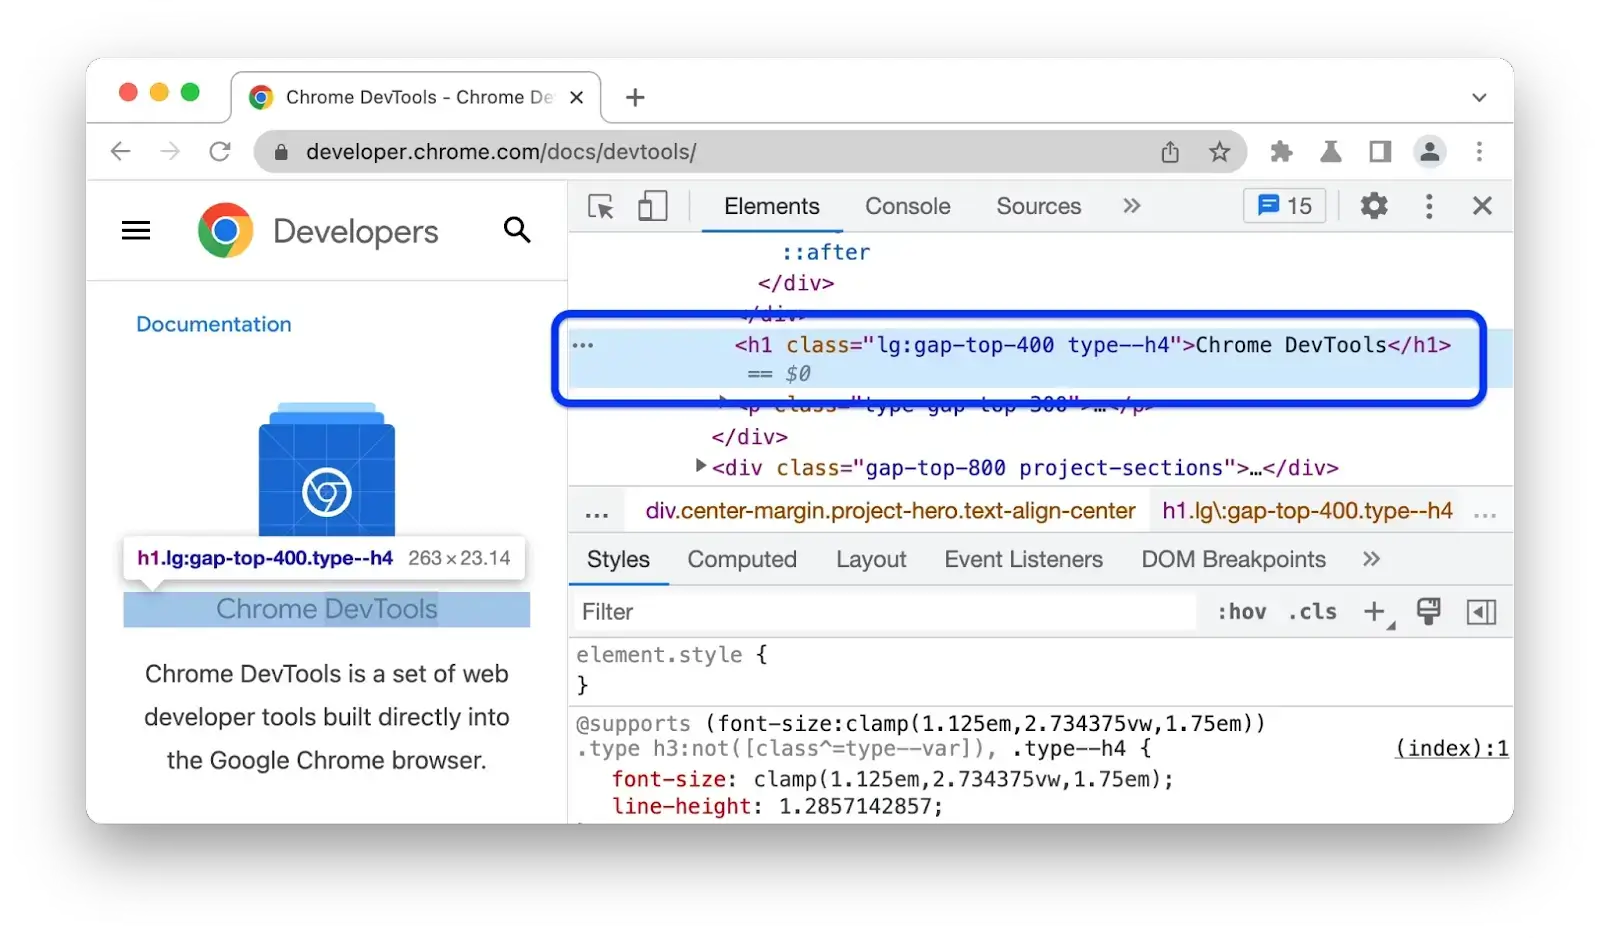
Breakpoints is a functionality through which a developer can control the flow of program execution by pausing it at a few points. These breakpoints are selected before the compilation and can be done by clicking beside the code lines in any debugger or browser. Once the statement at which the breakpoint is created is reached, the program pauses, and the developer can view various variable values and other intermediate calls till that point.
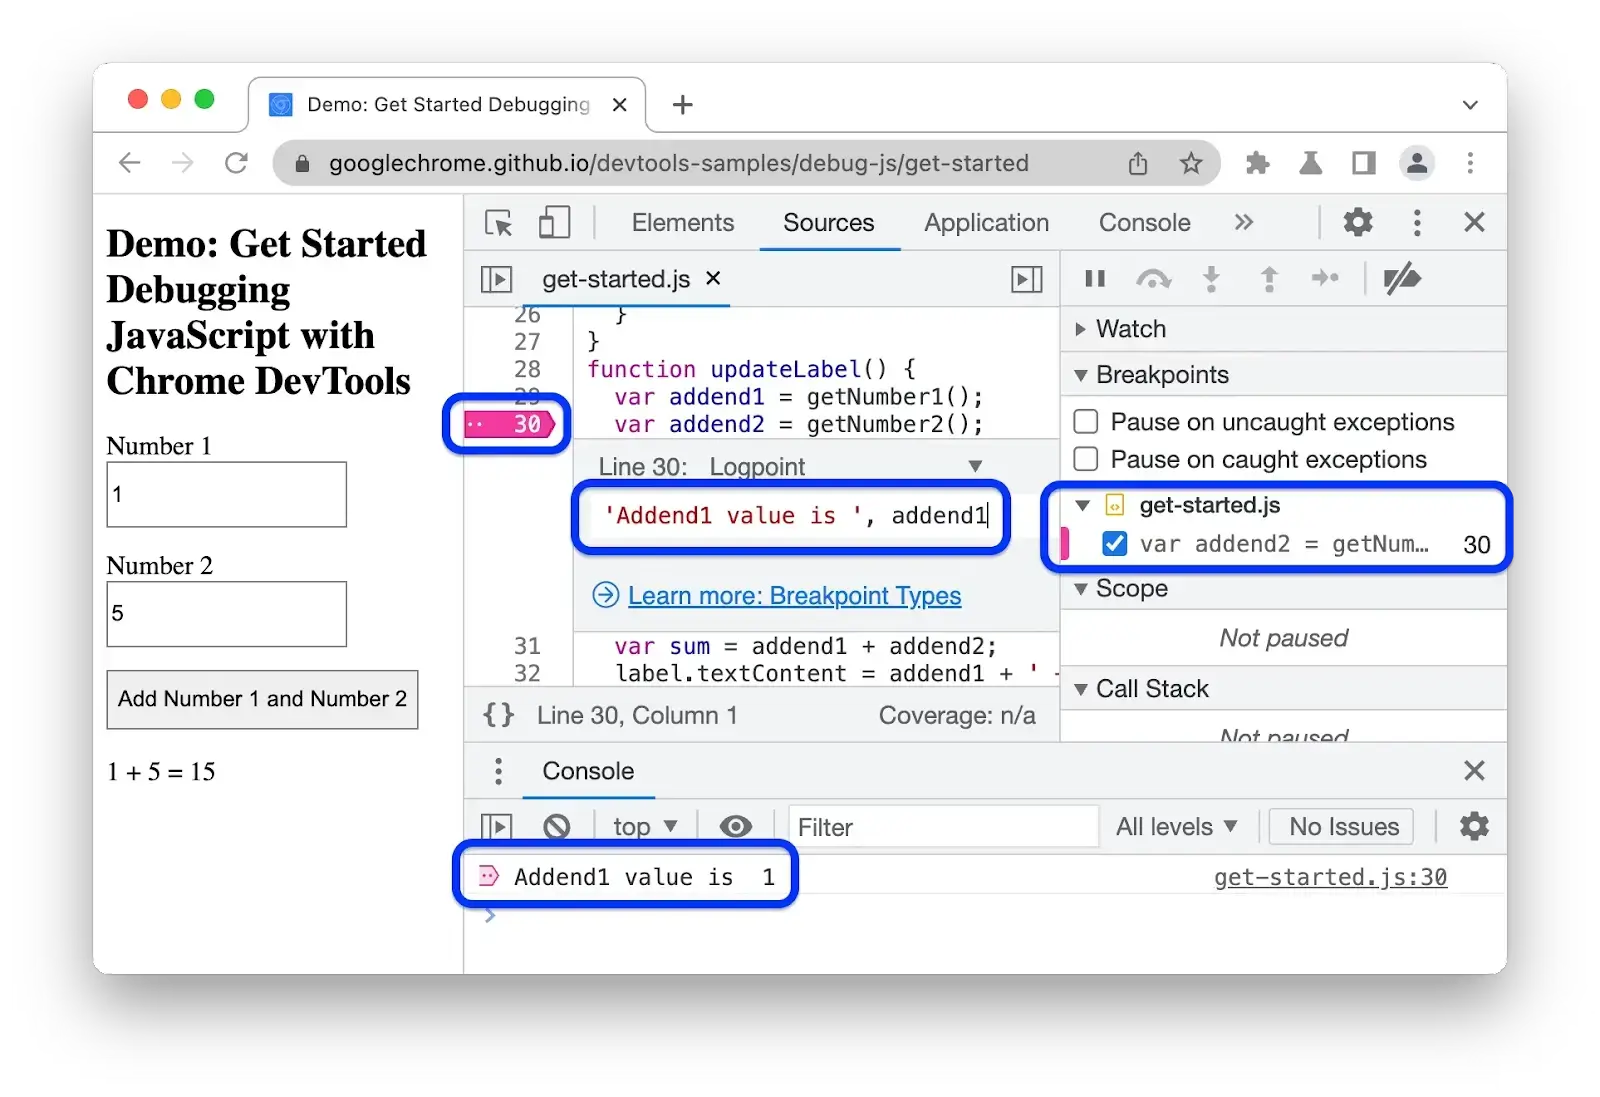
From there, the program continued usually. Some debuggers keep the program execution to one line once the first debugger is reached and give the option to skip this function and continue normally.
On the other hand, some debuggers work only from breakpoint to breakpoint. Once a breakpoint is resumed, the program then pauses at another breakpoint, and so on.
Breakpoints are a great way to start the debugging process and collect analysis data that gives an idea about what had gone wrong. The “where” part, however, is a bit trickier. If it is explicit, breakpoints are enough; otherwise, the developer may need to adopt other methods.
Learn how to use breakpoints when faced with issues in the code during development and testing. You can start with this blog on how to use breakpoints for debugging.
Writing Unit Tests
A popular preemptive approach that has picked up in the past decade is consistently using unit tests before pushing the code into production. Unit tests are a barrier to the new code and can be considered a shorter form of regression. These thousands of unit tests are run when a code is added or modified and help the developer know if existing methods and function calls work as expected.
The use of unit test cases is to ensure that bugs are not present in the newly added code. Even if they hide themselves from this scrutiny, these bugs will be isolated as other features remain intact. So it becomes easier to debug.
Due to their immense popularity, many frameworks have emerged in the same domain. This includes TestNG, JUnit, pytest, and many more. Also, all the IDEs currently support unit testing frameworks for all the major programming languages.
Get the complete tutorial on testing frameworks, explore different automation testing frameworks, and get valuable insight to help developers and testers choose the best framework that suits project requirements.
Logging
Another preemptive debugging technique put in place before the release of the software is logging frameworks. Logs are the best way to determine what went wrong without ever reproducing the bug or trying to execute the program on your machine. They even provide the flow that occurred when the user was operating, exceptions occurred, and the values generated in the process.
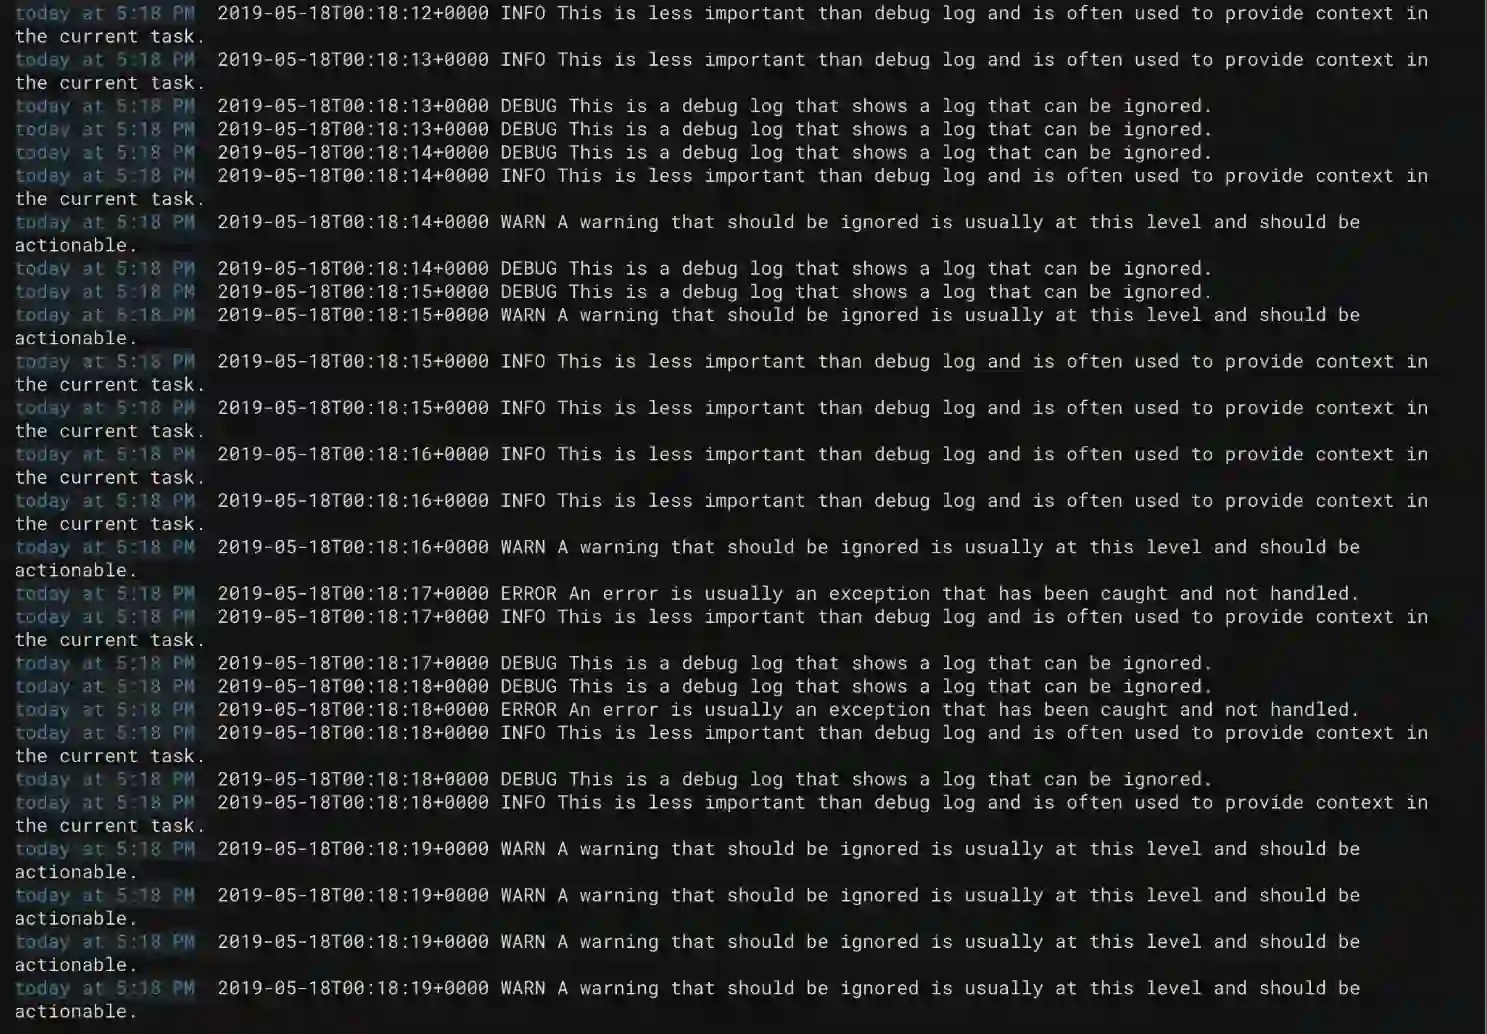
The only thing to remember is that the developers should document the logs efficiently. They should not be all over the codebase, and neither should they be too few that he loses to make connections. Apart from these popular approaches, developers sometimes use other methods such as connecting with the end user, creating mock-ups, adopting in-sprint techniques, test-driven development (TDD) approaches, and many more.
Now that we are fully aware of the different approaches that developers must follow and how these approaches help developers rectify errors and help them deliver quality software, let us understand the mindset of a developer to know how they solve the identified errors.
Mindset to Debug Code
Now that the developers know the strategies, techniques, and methods to debug their code, they need to know the path to follow from start to end. It involves changing a developer's mindset and preventing them from jumping directly on implementation. The process of debugging the code is a multi-step process as follows.
- Understand the Error Message
- Narrow Down the Area of Impact and Effect
- Identify Techniques to Find the Error
- Rectify the Bug or Conclude the Resolution
- Testing
First, understand what the error is all about. Start by reading the bug report multiple times and try to retrieve all the relevant information about it.
Giving it enough time will save the developer from backtracking and making wrong changes in the code. Also, each time developers read the report, they will learn something new each time they read the report.
For instance, let's say the developer is assigned a bug related to the glitches in the UI after a version update. They may think that they know why this is happening and try to reproduce it on their system, but to no avail. After many tries, the developer may be forced to comment that the bug is not reproducible, only to find later that the bug explicitly mentioned the update was from version A.B. to A.C. only, whereas the developer used a different version.
Understanding the error message can be half of the work done, as everything we do next will somehow relate to this first step.
Once the developer understands the error message, they can either try to reproduce it or, if already familiar, immediately think of the area from where the bug has risen. Try to isolate that area to concentrate on a limited code base for quick resolution. Also, explore the area where the bug has impacted the code base. It may not need any code changes but will ensure that the developer leaves no scenario just to get the bug reassigned in a few weeks again.
The debugging techniques and approaches discussed in the above sections are implemented in this phase when the developer knows what they are doing and where. The main focus of this phase is to know exactly what went wrong, at which line, and why this bug has appeared in the code base.
Until now, the developer knows what went wrong and the reason behind it. However, it is also a fact that not all bugs are rectifiable. Some may be too complex to rectify and require large changes across many files. Third-party functionalities may restrict some and cannot fulfill the requirements asked in the bug report. Some may not even be a bug.
What needs to be done after the bug has been identified in this phase? The same needs to be documented inside the bug report, and the bug should be marked as resolved.
If the bug requires code changes, it needs to be tested similarly to how the developer would test a newly implemented code. This process will ensure that the bug has been rectified, the impacted code is working fine, and the new code changes have not impacted any old code. Unit tests are essential to this process; however, organizations always ensure the code changes are stable through regression and farm tests. This process is similar to when a new code change is implemented for a new feature.
Once the test cases give us the green signal, the developer can merge the changes in the stable code and update the bug. The end of this phase also marks the end of the debugging process.
The testing phase can be challenging when it comes to repetitive testing. Every time the code is changed, it is used to check the application functionality and to ensure that new features added to the existing code have not broken the application. This type of repetitive testing can be conducted via regression testing. With regression testing, the repetitive testing process is solved, and the QA teams can focus on other main testing phases of development.
Now that we know how the developer mindset works and what steps are taken to resolve the errors, can a developer automate the debugging process to help me match his mindset to debug and help him read or analyze the error status better?
In the next section, let us see if automation can help developers debug the code.
Automation in Debugging
All the practices and methods described in this post look largely manual. This is because, well, they are! Debugging does not have set rules to follow and might be one of the most “human” things to do in computer science. Developing a machine that can think like humans and derive a hypothesis based on the project is difficult.
With this, one may conclude that automation does not exist for debugging. However, with the rise in artificial intelligence and machine learning capabilities of a machine, things have started to change. Automation in debugging can be constrained to extremely simple errors, such as a web app code mentioning an ID in JavaScript that does not attach to any element. AI can detect such things and even correct the IDs if it has prior knowledge of the element.
Static and dynamic analysis are also areas where automation is applied in debugging. These methods can identify the values of variables at a point and compare them with the values expected through automation tests. However, using a cloud-based platform to help developers automate the debugging process can be beneficial. One such platform is LambdaTest. It is an AI-powered test orchestration and execution platform that lets you run manual and automated tests at scale with over 3000+ real devices, browsers, and OS combinations.
In the following section, let us discover the tools that make debugging easy for developers.
Tools for Debugging
Currently, many tools are available for the debugging process. Here are the most commonly used ones worldwide. To keep it simple, the list is divided into the broader areas where these tools are applicable.
Web-Based
The following tools are preferred while working on a web-based application.
- Chrome DevTools
- LT Debug
The developer tools available in Google Chrome or any other browser (all browsers have this feature) are a great way to debug the code and contain all the necessary features. These Chrome DevTools are gone, and basic debugging options perform activities like Inspect element, Console, Networking, Performance, and more. Using web-based debugging tools that are limited to debugging activities when offering more advanced options can be challenging.
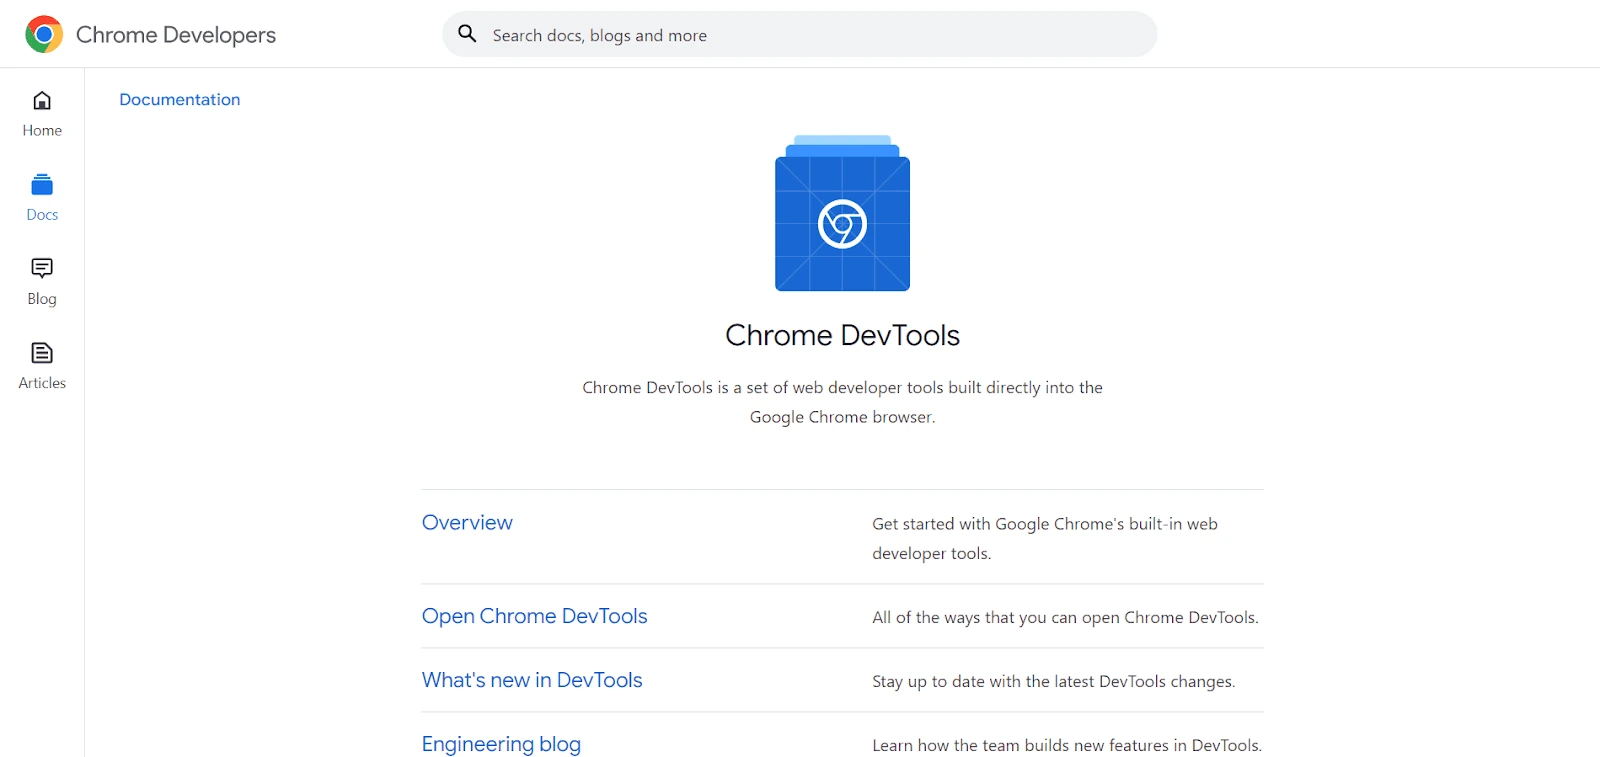
To overcome such challenges, using a cloud-based debugging tool can be beneficial. It can help developers identify bugs and simplify the debugging process with a wide range of advanced facilities to bug the problem and help fix it quickly. Now, let us see cloud-based tools like LT Debug offered by LambdaTest.
LT Debug from LambdaTest is a simple and free tool for developers that adds a new layer to your debugging needs. Installing LT Debug is easy. Go to the LT Debug Chrome Extension page and add the Chrome extension. Once you do that, you can use the features without much trouble.
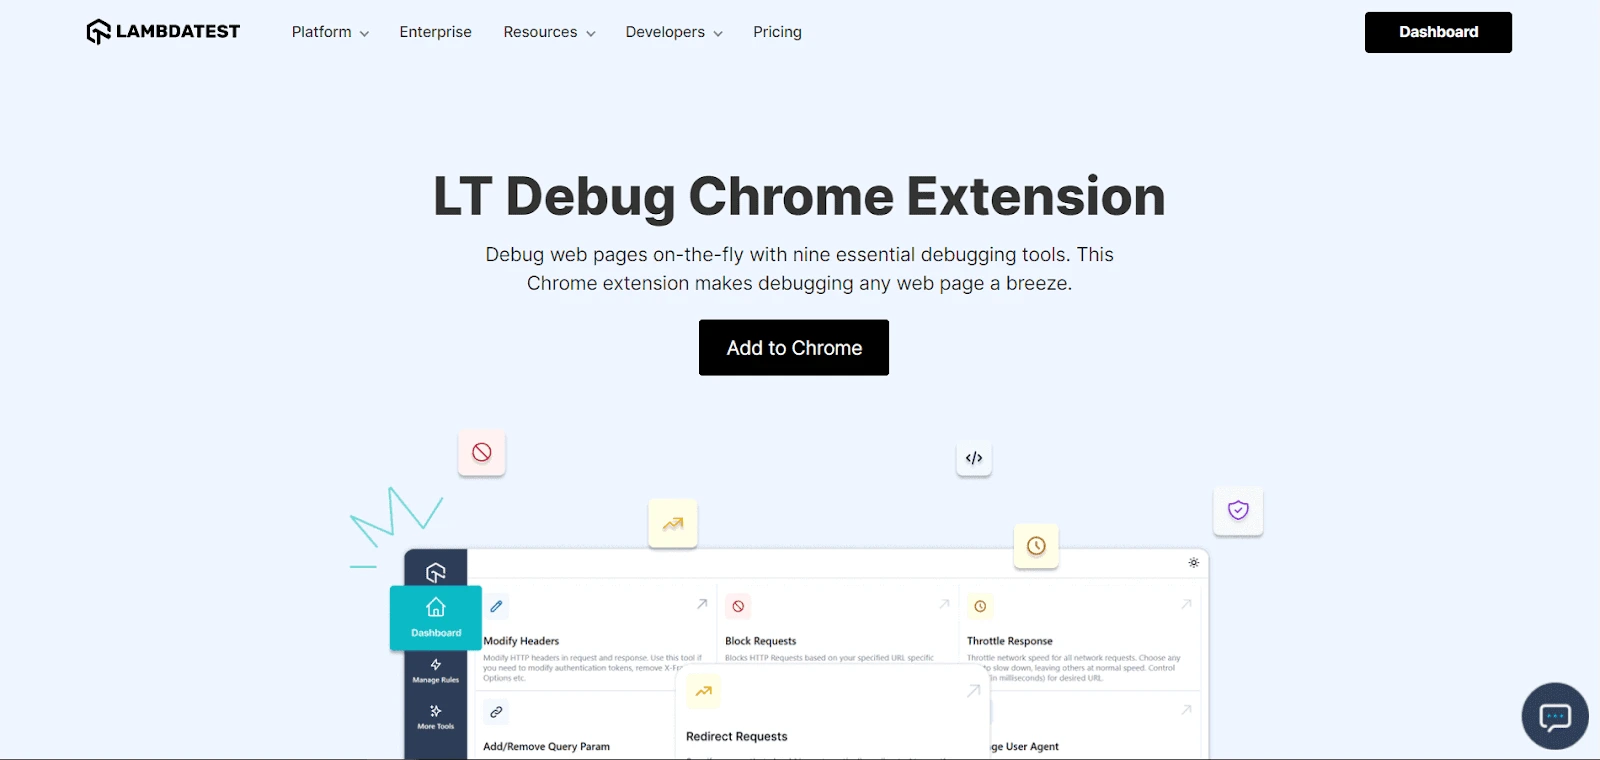
- Easily add, remove, or change request or response headers for testing header details quickly.
- Block HTTP requests based on specific URL filter conditions.
- Manage network speed for each request with network throttling.
- Add or remove query parameters.
- Use the redirect request tool to configure a URL to redirect to your preferred web URL.
- Quickly switch between different user-agent strings.
- Simulate the web page experience by injecting CSS or JS scripts into the console.
- Add the (Access-Control-Allow-Origin: *) rule to your response header for rapid cross-domain Ajax requests in websites and web apps.
- Remove the content security policy header on any website or web page with content security policy functionality.
Here are some reasons why LT Debug by LambdaTest is a great debugging tool:
Customers using this tool have not reported any significant disadvantages.
Test-Based
The following tools are preferred when the goal is to go for preemptive debugging by constructing unit test cases for the application; some Test-based tools are mentioned below.
- JUnit
- Unittest

JUnit is the most commonly used unit testing framework in Java programming language. Involved in testing since 2002, JUnit brings the method of using annotations adopted by other frameworks as well. It is lightweight and easy to learn for beginners as well.
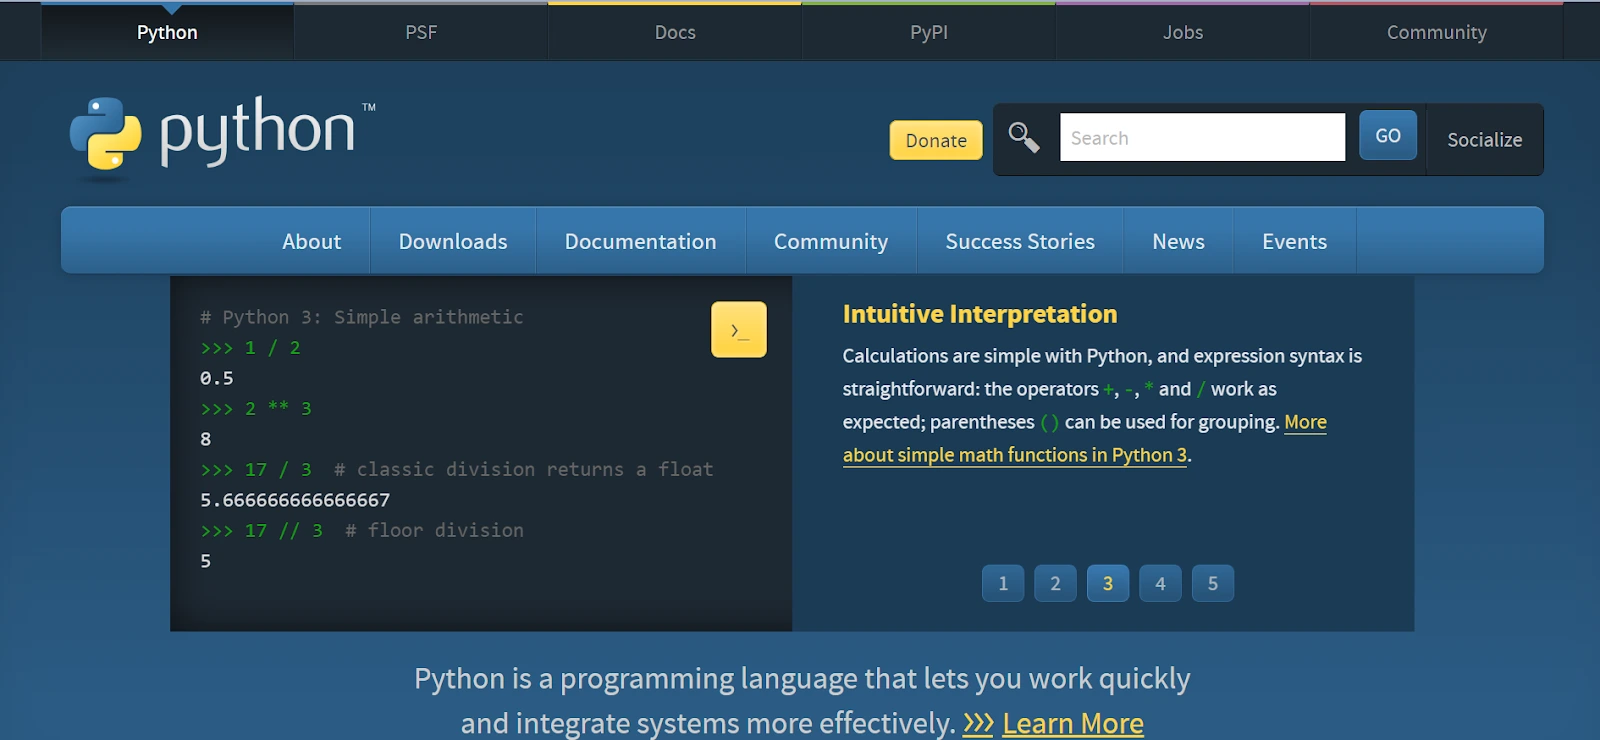
For developers working in Python unittest is probably the best framework for unit test cases. This framework is inspired by JUnit and brings all the major features included in its library. This includes shutdown code, setup code, independent test case creation, creating collections, etc.
Explore this blog on best automated testing frameworks, which will give QA testers and developers valuable insights to choose the best framework to start with that suits them best as per requirement.
IDE-Based
Debuggers also are supported in IDEs where all the major features like breakpoints and time travel can be experienced. These are meant to be created as a plugin for popular IDEs, and if you are using one of the following IDEs, it is always recommended that you install one.
- Visual Studio Code
- IntelliJ
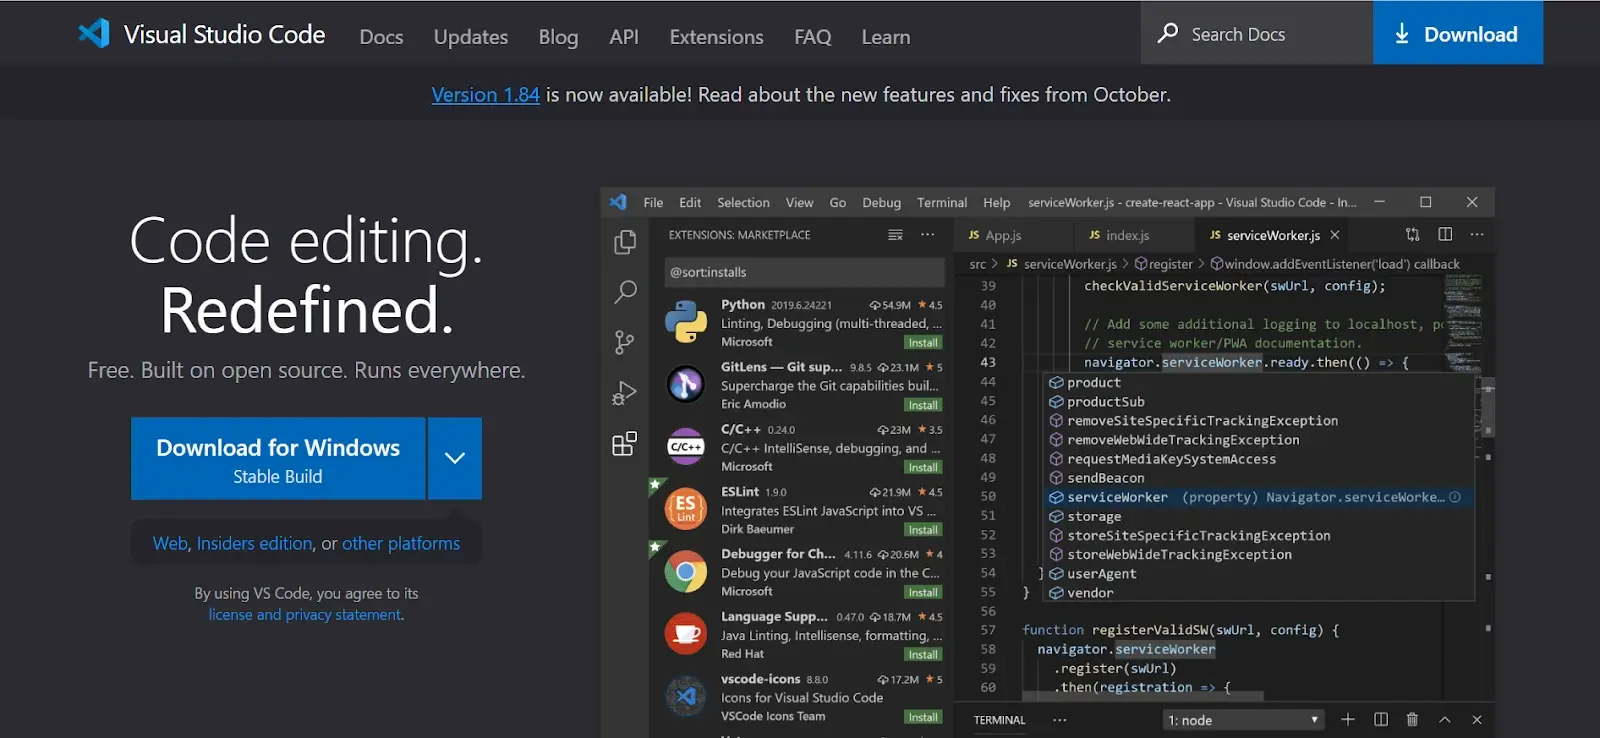
Visual Studio Code is a popular IDE for people who prefer to work on highly efficient tools in debugging. It provides rich cross-language debugging in local, remote, and production settings. It allows developers to use advanced breakpoints where conditions can be incorporated along with the normal execution flow.
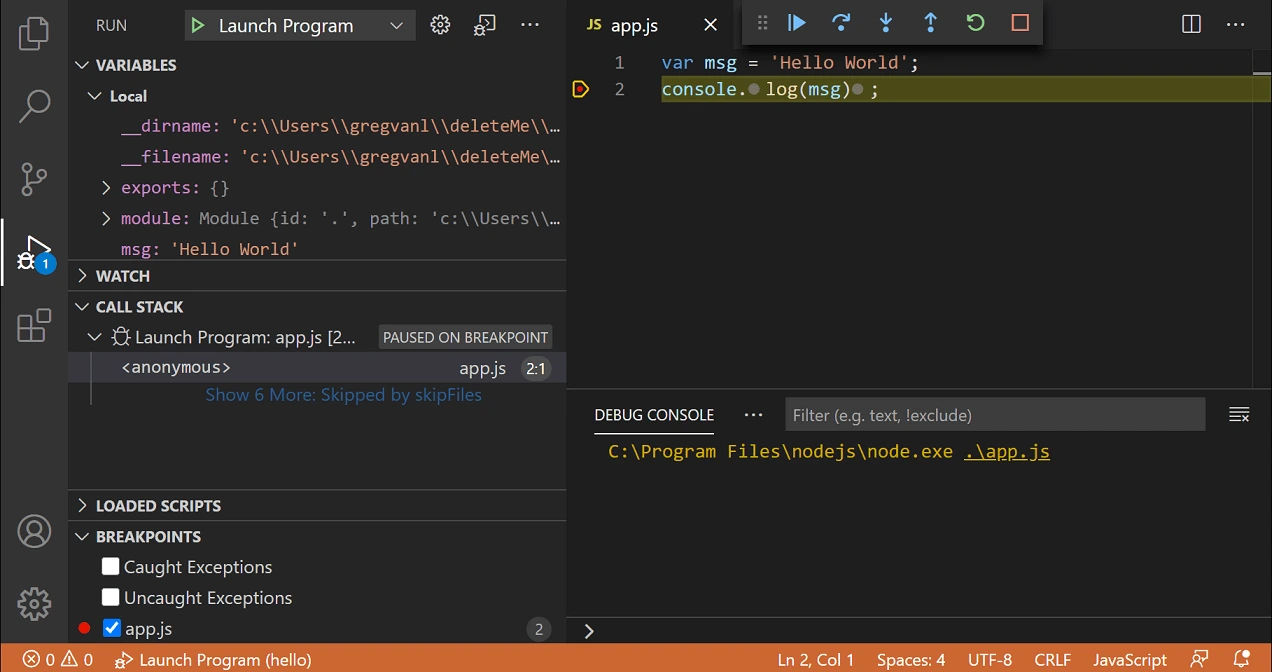
With customized alerts based on exceptions and other fatal scenarios, Visual Studio Code provides fine-grained control over the application.
The IDE comes installed with essential and advanced debugging features. The list includes configurable breakpoints, stepping into the program for linear flow, analyzing asynchronous code, java concurrency method calls, and even observing the program in the JVM heap structure.
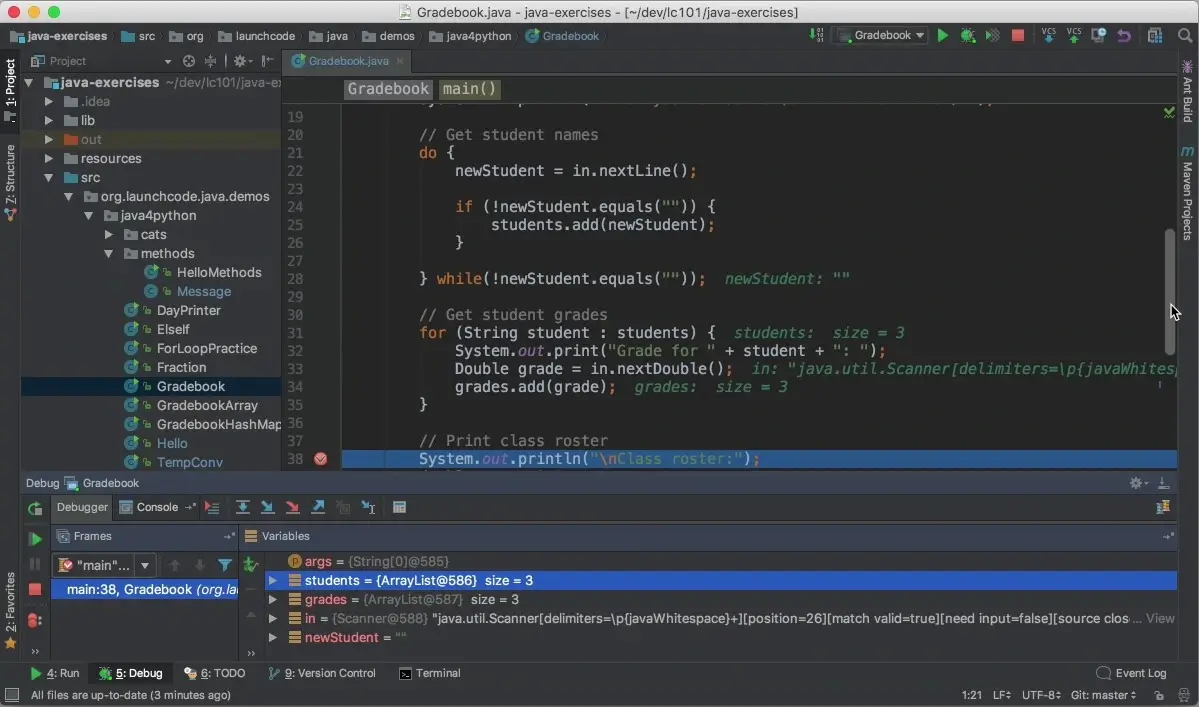
IntelliJ has a straightforward learning curve, and since the community is big, developers can always turn to them whenever stuck to help debug even faster.
Command Line-Based
The following tools work and operate on the command line application. They ensure the features provided by shell, and therefore, developers need to ensure they are working on the shell of their choice. Otherwise, a few of the commands would be absent.
- GDB
- Vim
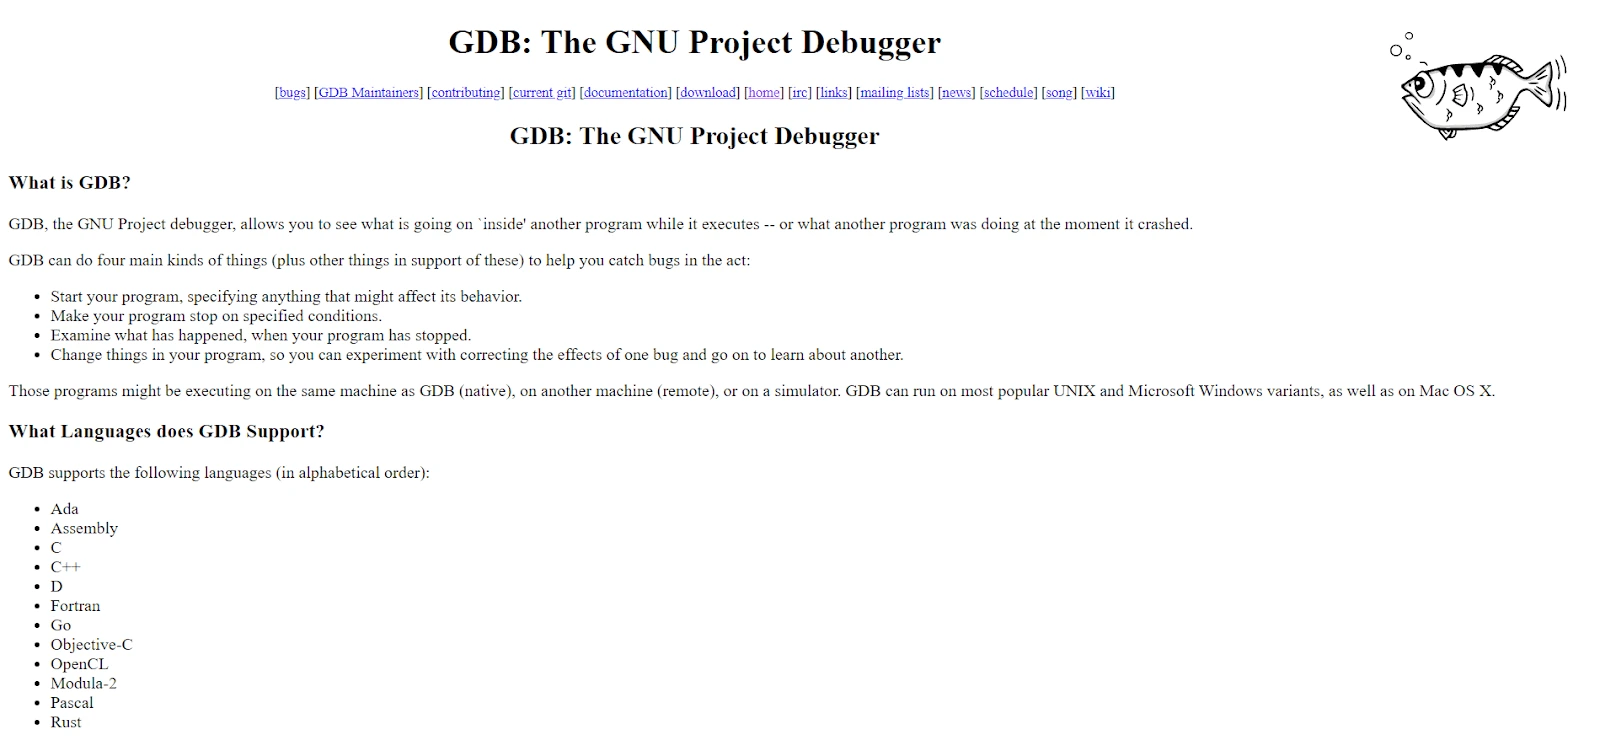
GDB, abbreviated for GNU Debugger, is a tool in service since 1986. It is a portable debugger for Unix-like systems and supports multiple programming languages for debugging the application. GDB enables remote debugging and comes with features such as internal variable alteration, independent function calling, and monitoring facilities. Targeting a long list of computer processors, GDB is still in active development and a priority choice for many Linux users.
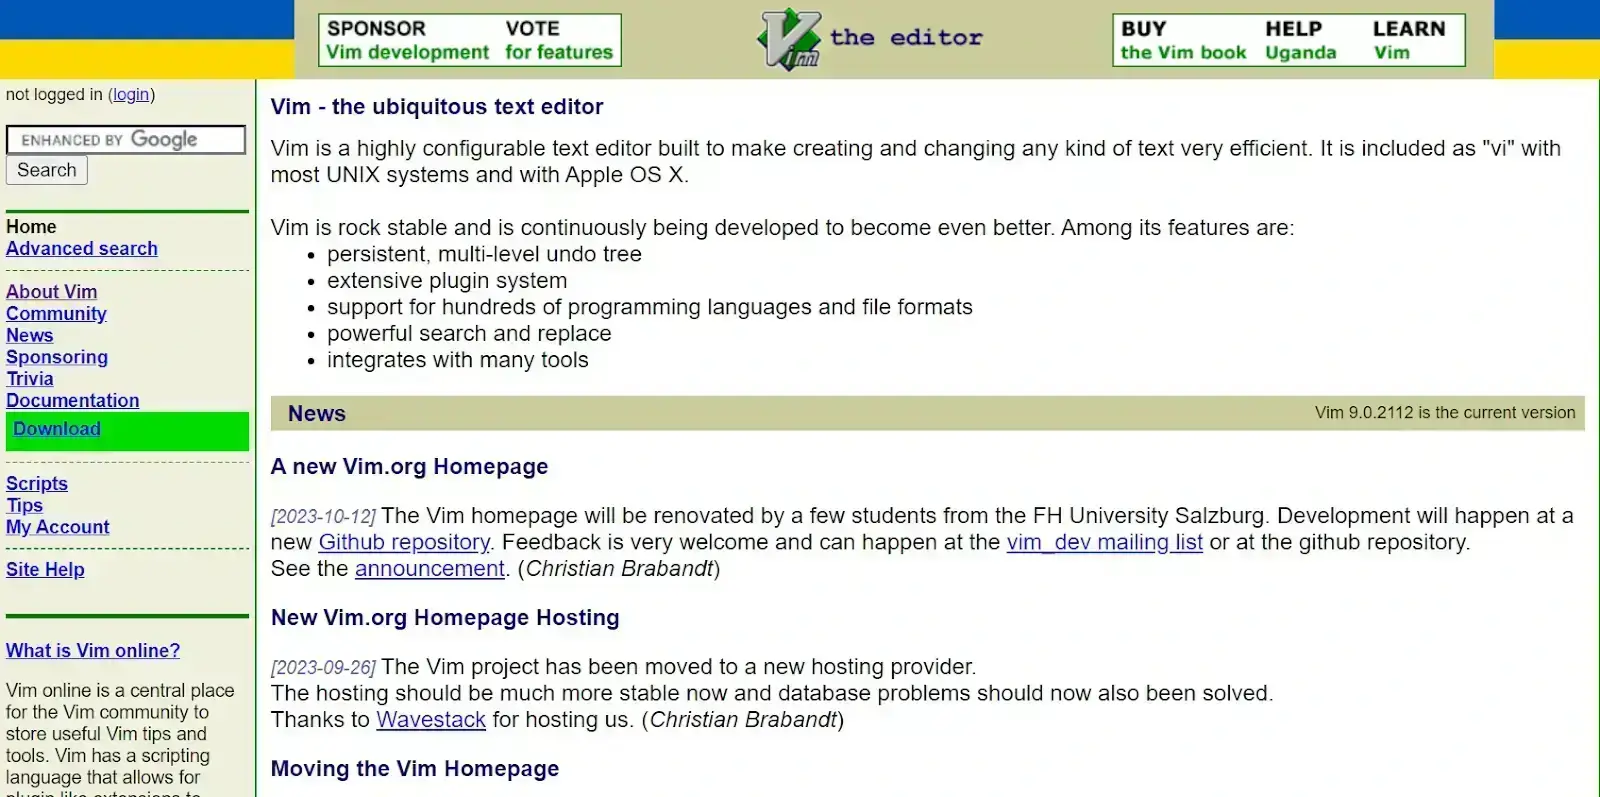
Vim is a text editor available on the command line for Unix operating systems. A more modern version of it with functionalities working for ease of working is Vim. While Vim is mainly a text editor, it supports debugger plugins to extend its functionality as a debugger. It also helps the developers working on Vim, as they do not need to learn multiple frameworks for multiple tasks. The functionality that Vim will provide as a debugger will depend on the debugger plugin attached. For instance, vimgdb will bring the power of GDB and the ease of vim into one package.
These debuggers are enough to start the journey of debugging. They are powerful, have all the essential features, and provide excellent community support. To learn more about other debugging tools, read this blog on the best debugging tools to learn more about their features.
The final choice depends on the type of application the developer is working on and their personal preferences.
Until now, we have been looking at fixing issues in software functionality. Let's discuss finding and fixing problems when people use different web browsers and devices. In the following section, we will see how developers can figure out and solve these cross-browser-related bugs.
Cross-browser bugs - a particular category
A special category that might get shadowed out in the overwhelming options the developers have today is cross-browser bugs. Typically, when people discuss debugging, the attention is on issues like functionality, visual aspects, mistakes in the code, etc. However, cross-browser bugs are one category that exists even if everything is working fine on the developer’s system.
A cross-browser bug is raised purely due to the change in the device. Each browser has its protocols and standards by which it parses and renders an application. A similar issue is seen in different mobile devices where physical changes as small as a change in screen ratio can cause visual bugs. Such bugs cannot be coded immediately as developers may not know whether their code will cause issues on other browsers or devices.

The only method to expose cross-browser bugs is through cross-browser testing, and the team needs a platform that serves this special purpose only. So far, we used LambdaTest as our solution platform. The following section lets us see how LambdaTest helps eliminate cross-browser bugs.
How to Eliminate Cross-Browser Bugs Using LambdaTest?
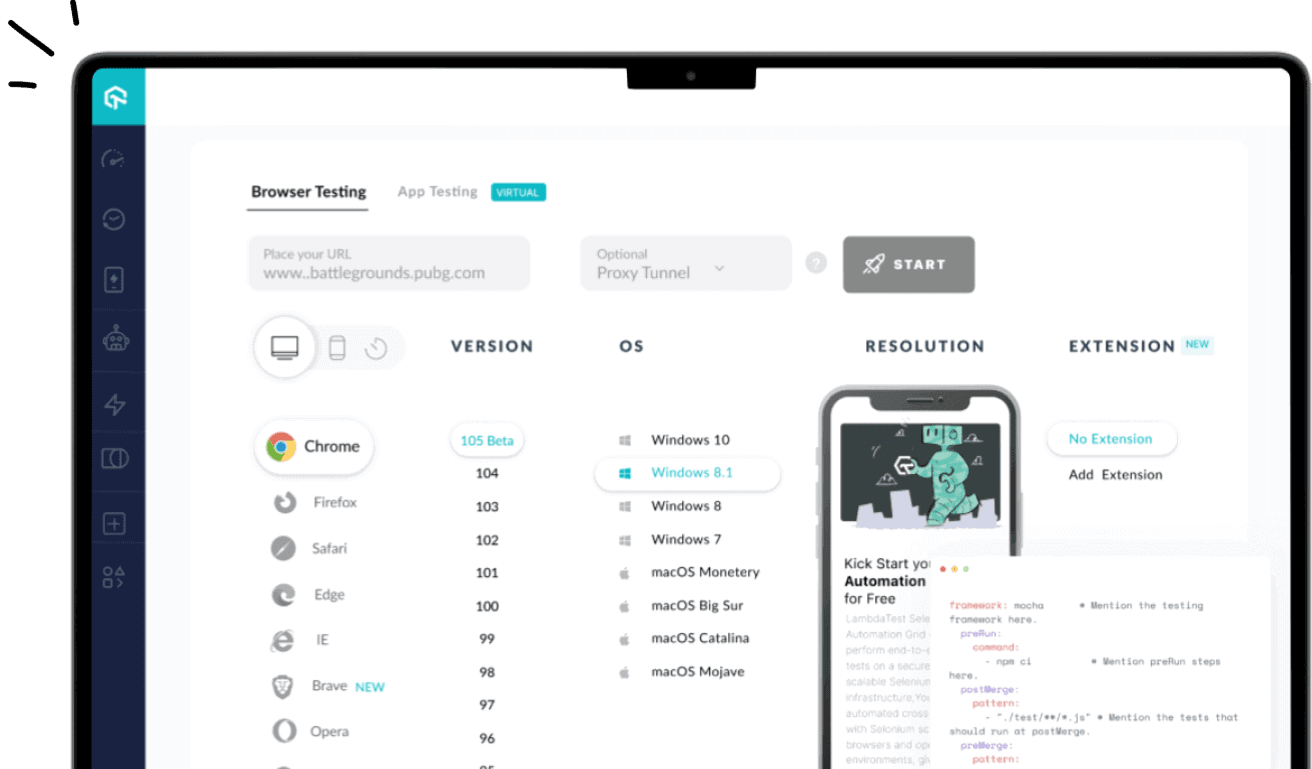
LambdaTest is an online platform testers use to satisfy their testing, including cross-browser and automation testing. The platform has over 3000+ screens and supports real device cloud testing. This helps assess the software application on actual physical devices to get accurate parameters without purchasing any device ourselves.
This platform has many testing supports, such as automation, allowing users to perform mobile app testing, visual regression testing, and more. Let us understand this cross-browser bug by demonstrating a real-time testing on browsers. This will help you get comfortable with testing easily and start quickly.
To perform real-time testing on LambdaTest, you need to follow some steps that are mentioned below.
Step 1: Create a LambdaTest account for free. Once you have logged in, it will redirect you to the dashboard.
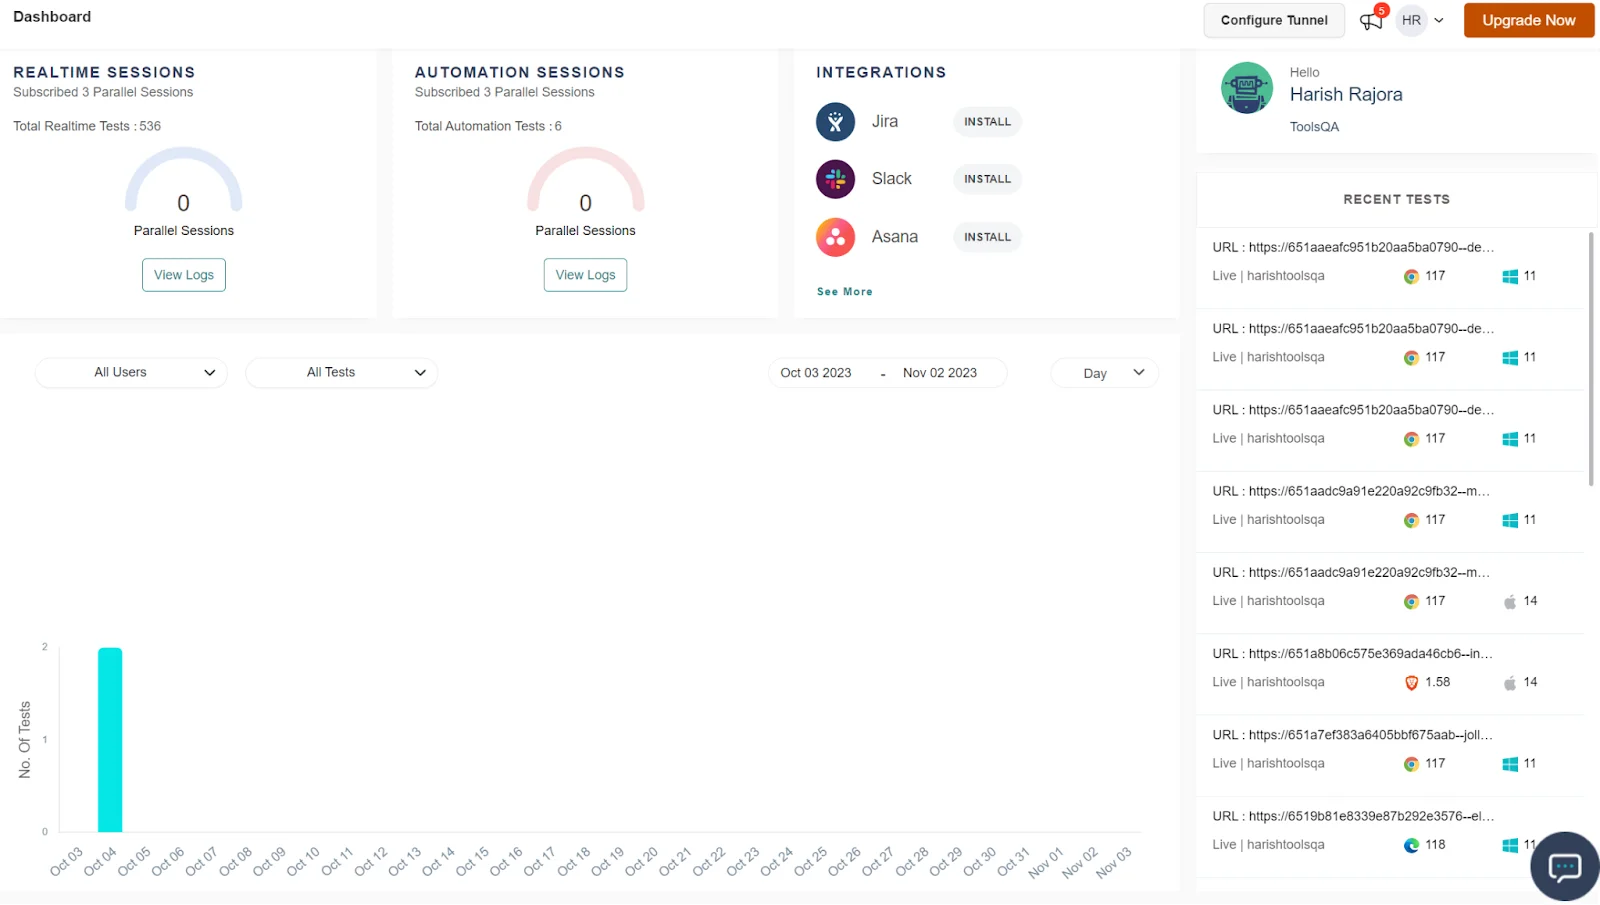
This dashboard highlights all user activities in the LambdaTest platform, providing a quick summary and helping to continue the testing process.
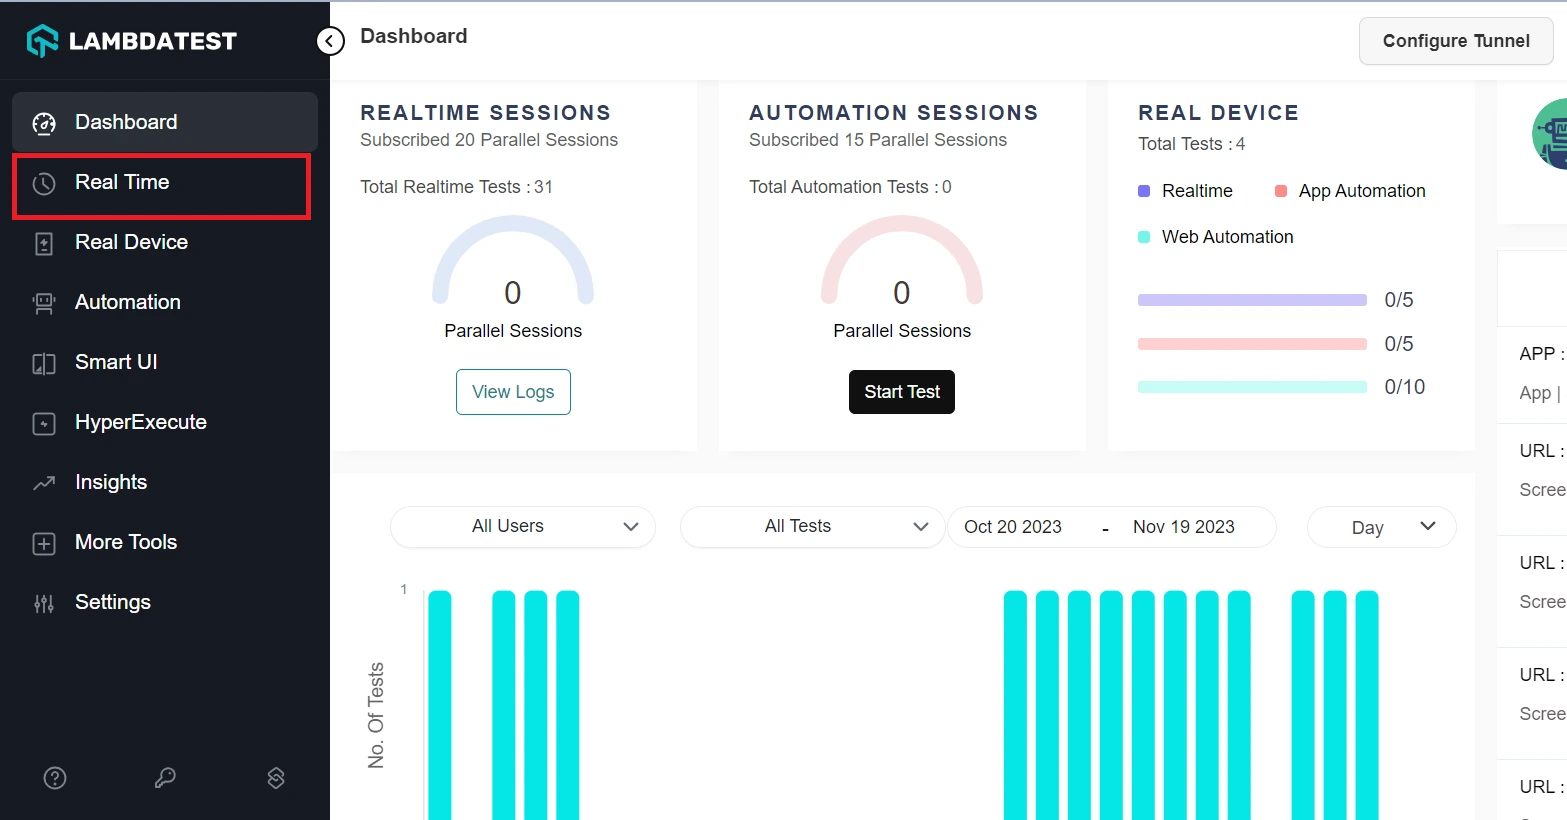
Step 2: Now, from the left side of the menu option, click on Real Time to perform real-time testing.
Step 3: From the given option, click on Browser Testing to perform real-time testing.
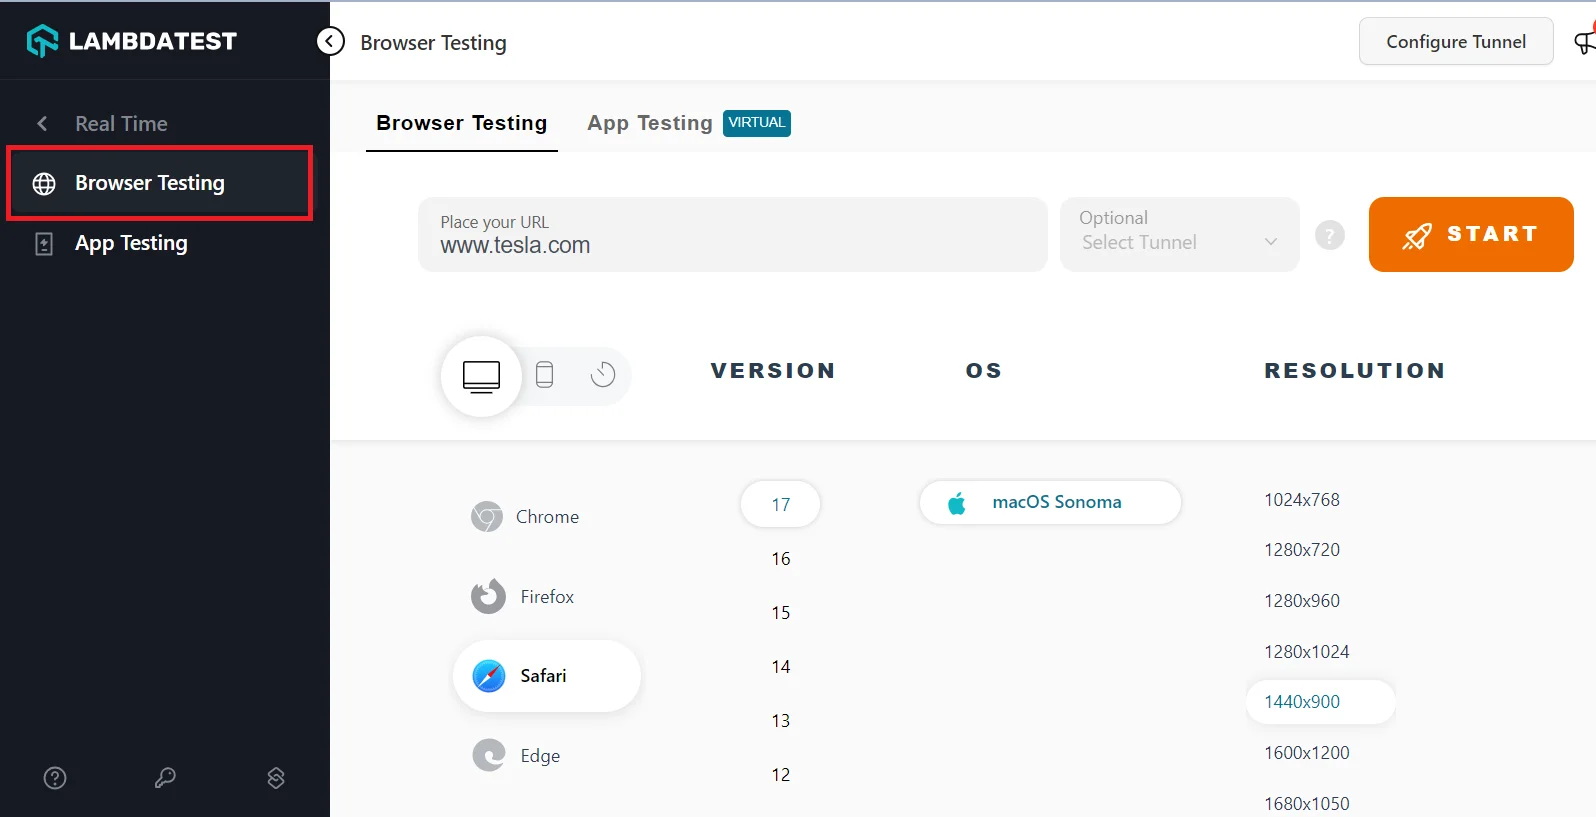
Step 4: On the right side of the panel, you need to enter the URL of the site you want to test and then select the browser, the browser version, the operating system, and the resolution. In this case, we have used Chrome as our browser, and the browser version to 118, the operating system as Windows 11, and set the resolution to 1920x1080.
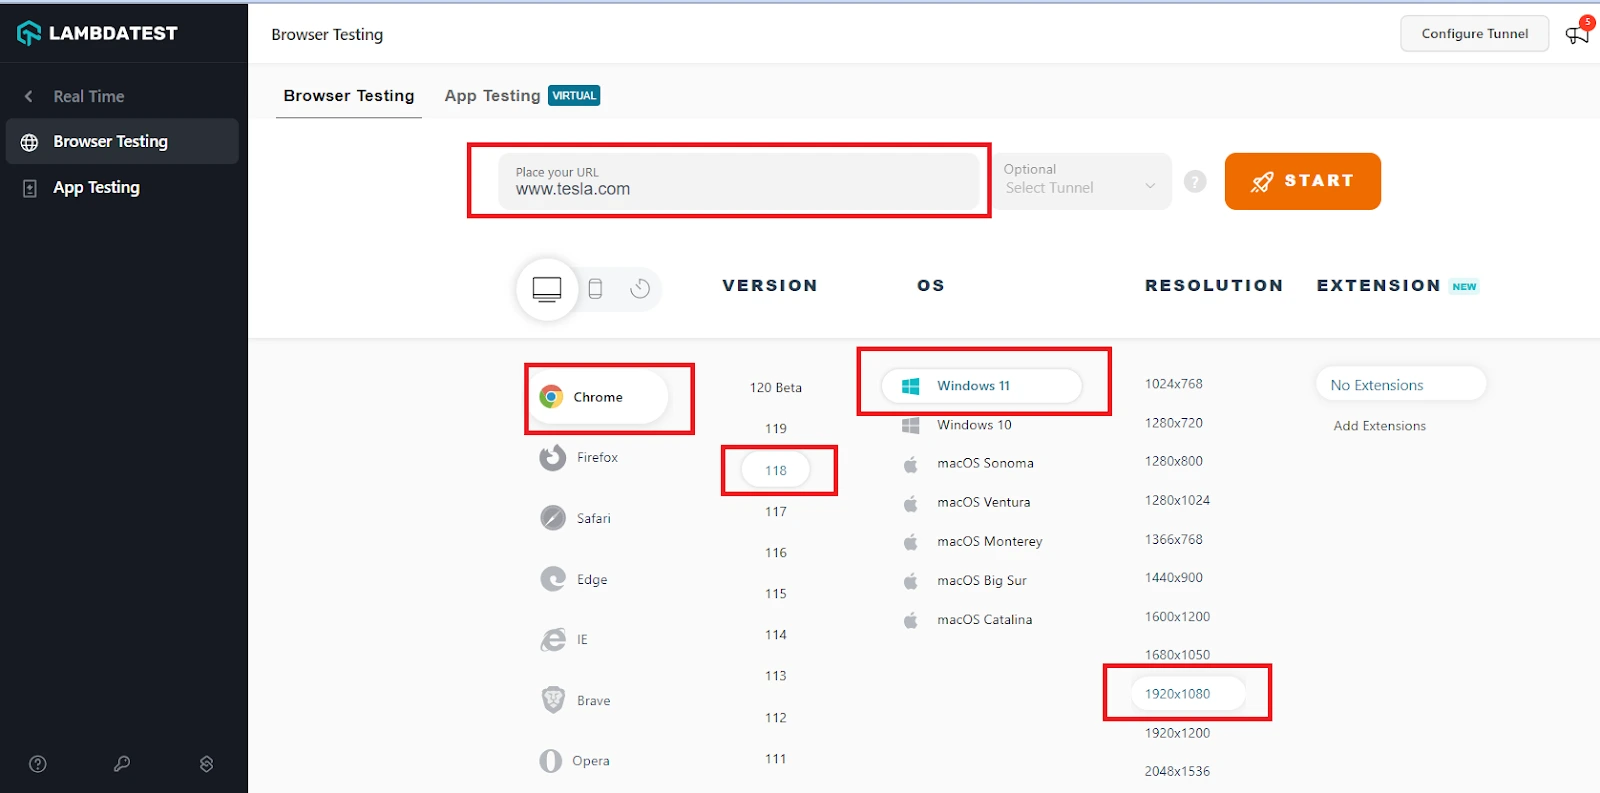
Step 5: Click START to launch the application on the selected configurations.
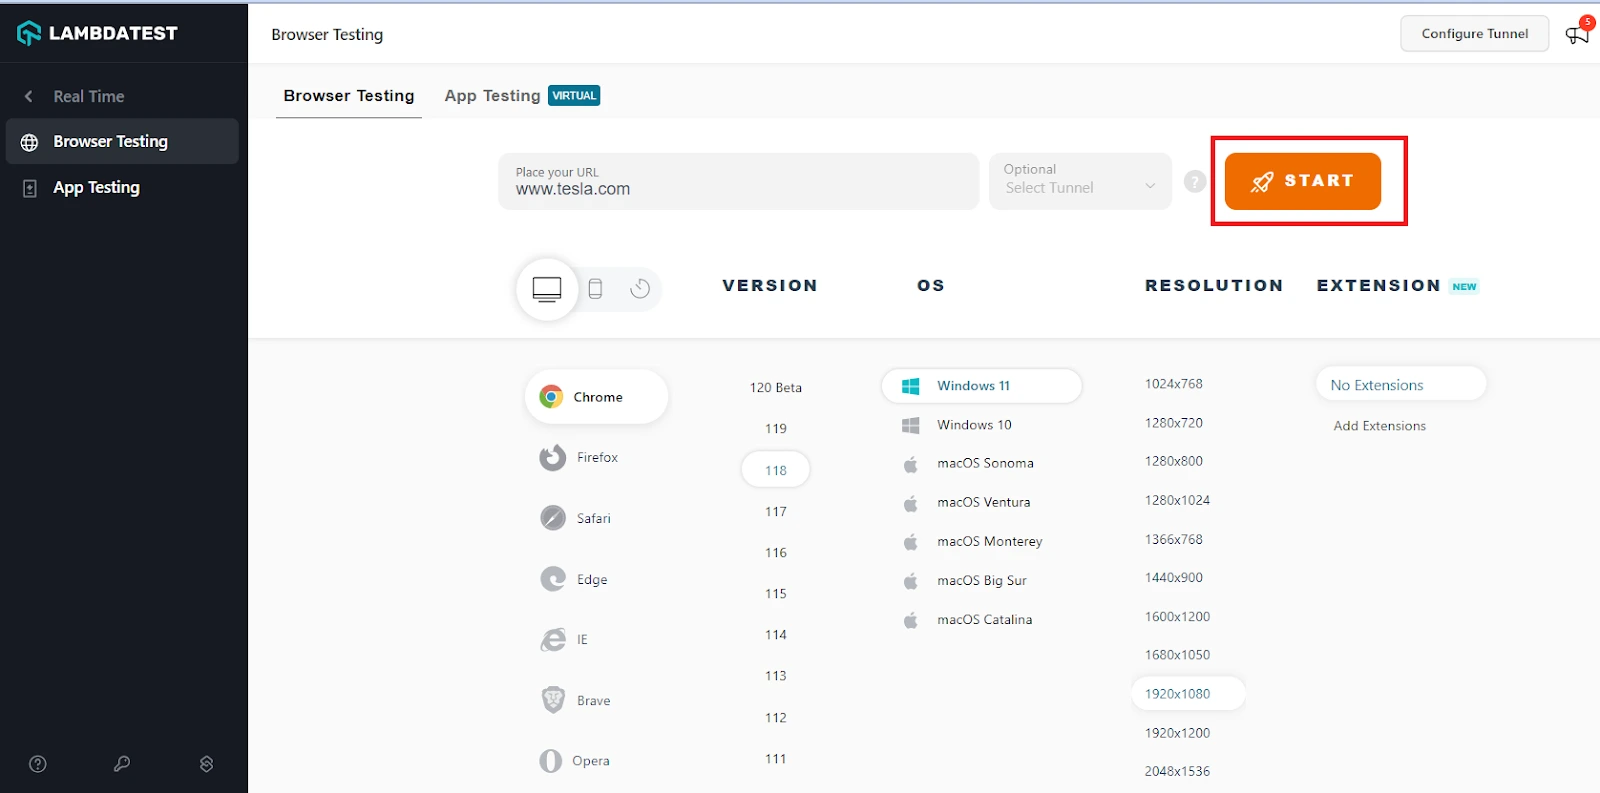
Give it some time to launch the application based on your configuration, and then you can see the website has loaded.


Step 6: The left tool panel provides many options for testing and debugging efficiently. The user can explore them and perform their first test efficiently.
Such platforms eliminate the need to construct and maintain heavy infrastructure, requiring constant monitoring and dedicated teams. Cross-browser testing exposes cross-browser bugs, rectified by incorporating additional scripts directed towards specific browser engines . It is a topic covered in good detail separately.
Now that we have seen many tools, types, and strategies, let us look into some best practices in the following section.
Best Practices to Prevent Bugs in the Application
Finally, before concluding this guide on debugging, let’s glance at what areas we need to focus on to ensure minimum bugs and an efficient debugging process.
Always use Preemptive Debugging
As mentioned repeatedly in this guide, preemptive debugging is a type of debugging that creates preventive measures to help debug easily and quickly. It also helps in exposing bugs in the early cycles of development.
Such techniques should not be optional in the application; developers should put preemptive debugging in place each time a new feature is implemented before pushing it to the testers.
Try Version Control
Version control systems such as GitHub or GitLab are almost always integrated as they have great advantages in software development. While maintaining the versions and monitoring new changes would top the list, debugging can be done if version control is used effectively
Version control systems can help observe the code that existed before a certain version release. If the bug is related to some new modifications, this can be identified within a couple of minutes, as version control systems have “diff” functionality embedded into them. It will also help quickly assign the bug to the developer who changed the code and knows much better about the reason behind the changes.
Comment all That is Necessary
Comments are an essential part of coding practices. It describes a developer's actions or reasons for adding the code beneath it. Sometimes, it is just for explaining the meaning of certain entities. While developers may sometimes feel it is unnecessary, they will forget why they added the code and what it does after a few weeks.
Comments are not only to recall the reason for adding the new code but also to let a new team member be apprised of the functionality; since the developer writing the code might leave, their replacement will instantly understand the logic without concluding themselves from the code. Hence, this facilitates debugging and helps wrap things up quickly.
Reproduce the Bug First
A bug may be documented in detail by the tester. If the developer can understand the bug and knows why it is occurring, it may tempt him to fix it immediately. Due to this, developers may miss a few scenarios that were not documented but definitely would have been explored if they reproduced them on the local system. For instance, a bug could be limited to just a particular environment the user is in. Changing the code may result in the correct working of the functionality in that environment but nowhere else.
Such mistakes can be avoided by reproducing the bug. It also helps explore other corner cases that may have been missed while developing the feature initially.
Do not Ignore Cross-Browser Testing
Cross-browser testing plays an essential role in minimizing platform-related bugs and enhancing the user experience by already being prepared for each device. This comes under one of the best practices to prevent bugs by preemptive techniques and using the time saved from debugging into other activities.
Make use of Debugging Techniques and Methods
The methods and techniques discussed in this post are proven to be effective against quick debugging and resolution of bugs. Developers are always recommended to avoid wandering around by hit and trial and to follow documented techniques for a better and smoother debugging process.
Consult an Experienced IT Professional
Finally, always know that what one new member will take to resolve in 2 days could be done within 10 minutes by experienced developers and testers. The reason behind this is their awareness of all the angles of the codebase and their experience in dealing with hundreds and thousands of glitches over the years. While the developers should start and try independently, it is better to consult an experienced employee if things are taking too much time to debug.
Conclusion
Bugs are a part of the software development process. An application reaching millions of users years into its inception is bound to have hundreds of leaks. A bug-free software is a hypothesis that worked only till software testing was not established as a concrete branch of software engineering. When one such bug is explored at any point in the application’s life, another process is initiated called “debugging”.
Debugging is a process of finding the root cause of the bug, exploring its impact in the code base, implementing corrective code, resolving the bug, and finally pushing it to the main code base. As direct as it may sound, finding the root cause can sometimes take a couple of days. This time, however, increases multifolds when the developer has no fixed plan but just tries his luck through various random methods. This guide aims to establish just that and provide a concrete path to follow for the developers.
From types of bugs to expected methods to follow till resolution, this guide on debugging is all you need to resolve bugs faster and avoid them from coming into existence in the first place. With this, we conclude this guide with a quote from one of the most popular computer scientists, Edsger Dijkstra
"If debugging is the process of removing software bugs, then programming must be the process of putting them in. "
On this page
- Overview
- A Brief History of Debugging
- What is Debugging?
- Why do we Need Debugging?
- Types of Debugging
- Types of Errors Developer Encounters
- Strategies for Debugging
- Different Approaches to Debug Code
- Mindset to Debug Code
- Automation in Debugging
- Tools for Debugging
- Cross-browser bugs - a particular category
- How to Eliminate Cross-Browser Bugs Using LambdaTest?
- Best Practices to Prevent Bugs in the Application
- Conclusion
- Frequently Asked Questions
Frequently asked questions
- General
Did you find this page helpful?
Author's Profile

Harish Rajora
Harish Rajora, He is a computer science engineer. He loves to keep growing as the technological world grows. He feels there is no powerful tool than a computer to change the world in any way. Apart from his field of study, he likes reading books a lot and write sometimes on Twitter.
Reviewer's Profile

Shahzeb Hoda
Shahzeb currently holds the position of Senior Product Marketing Manager at LambdaTest and brings a wealth of experience spanning over a decade in Quality Engineering, Security, and E-Learning domains. Over the course of his 3-year tenure at LambdaTest, he actively contributes to the review process of blogs, learning hubs, and product updates. With a Master's degree (M.Tech) in Computer Science and a seasoned expert in the technology domain, he possesses extensive knowledge spanning diverse areas of web development and software testing, including automation testing, DevOps, continuous testing, and beyond.
More Hubs
Try LambdaTest Now !!
Get 100 minutes of automation test minutes FREE!!
 Christmas Deal is on: Save 25% off on select annual plans for 1st year.
